How enhanced CX can boost 11 business metrics. New report by Uploadcare
Last edited:
In online retail, a positive customer experience is everything — that’s a fact no one would question. But what does that really mean? In this report, we’ve decided to break down this broad idea and show exactly how you can enhance the customer experience on your website, and how those enhancements can influence real business metrics.
The report will be interesting for people who are looking for opportunities to improve their business, and want to make decisions based on data. Download the full report now: Customer Experience Through Data
Customer experience through data: what’s inside
We analyzed over 20 studies and research papers and put together the core business metrics affected by customer experience issues.
| Active Customers | Online Penetration & Market Share | Average Basket Value (ABV) |
| Total Visits | Net Promoter Score (NPS) | Average Order Frequency (AOF) |
| Mobile Device Visits | Average Units per Basket (AUB) | Distribution & Technology Costs |
Then we went through these metrics one by one, gave a description of each, and outlined how an enhanced customer experience affects them, providing real-life examples and data along the way. Let’s explore some of our key findings.
Improving CX is key, 85% of business decision makers claim
According to a recent Frost & Sullivan survey, “improving customer experience” is a top-rated driver for commercial success for most businesses. It’s no surprise: customer expectations grow steadily, and online retail businesses are forced to find new ways to improve their traction.
Many businesses already understand that it’s no longer enough to compete on products or services. In our work, we find that how an organization delivers for customers is beginning to be as important as what it delivers.
— McKinsey, Customer experience: Creating value through transforming customer journeys
Exceptional CX starts with web performance optimization
Digital customer experience is largely about web performance: specifically, optimizing any shopping-related content for the fastest loading times possible. Fast loading times boost the number of pages viewed within each shopping session and increase the probability of purchase.
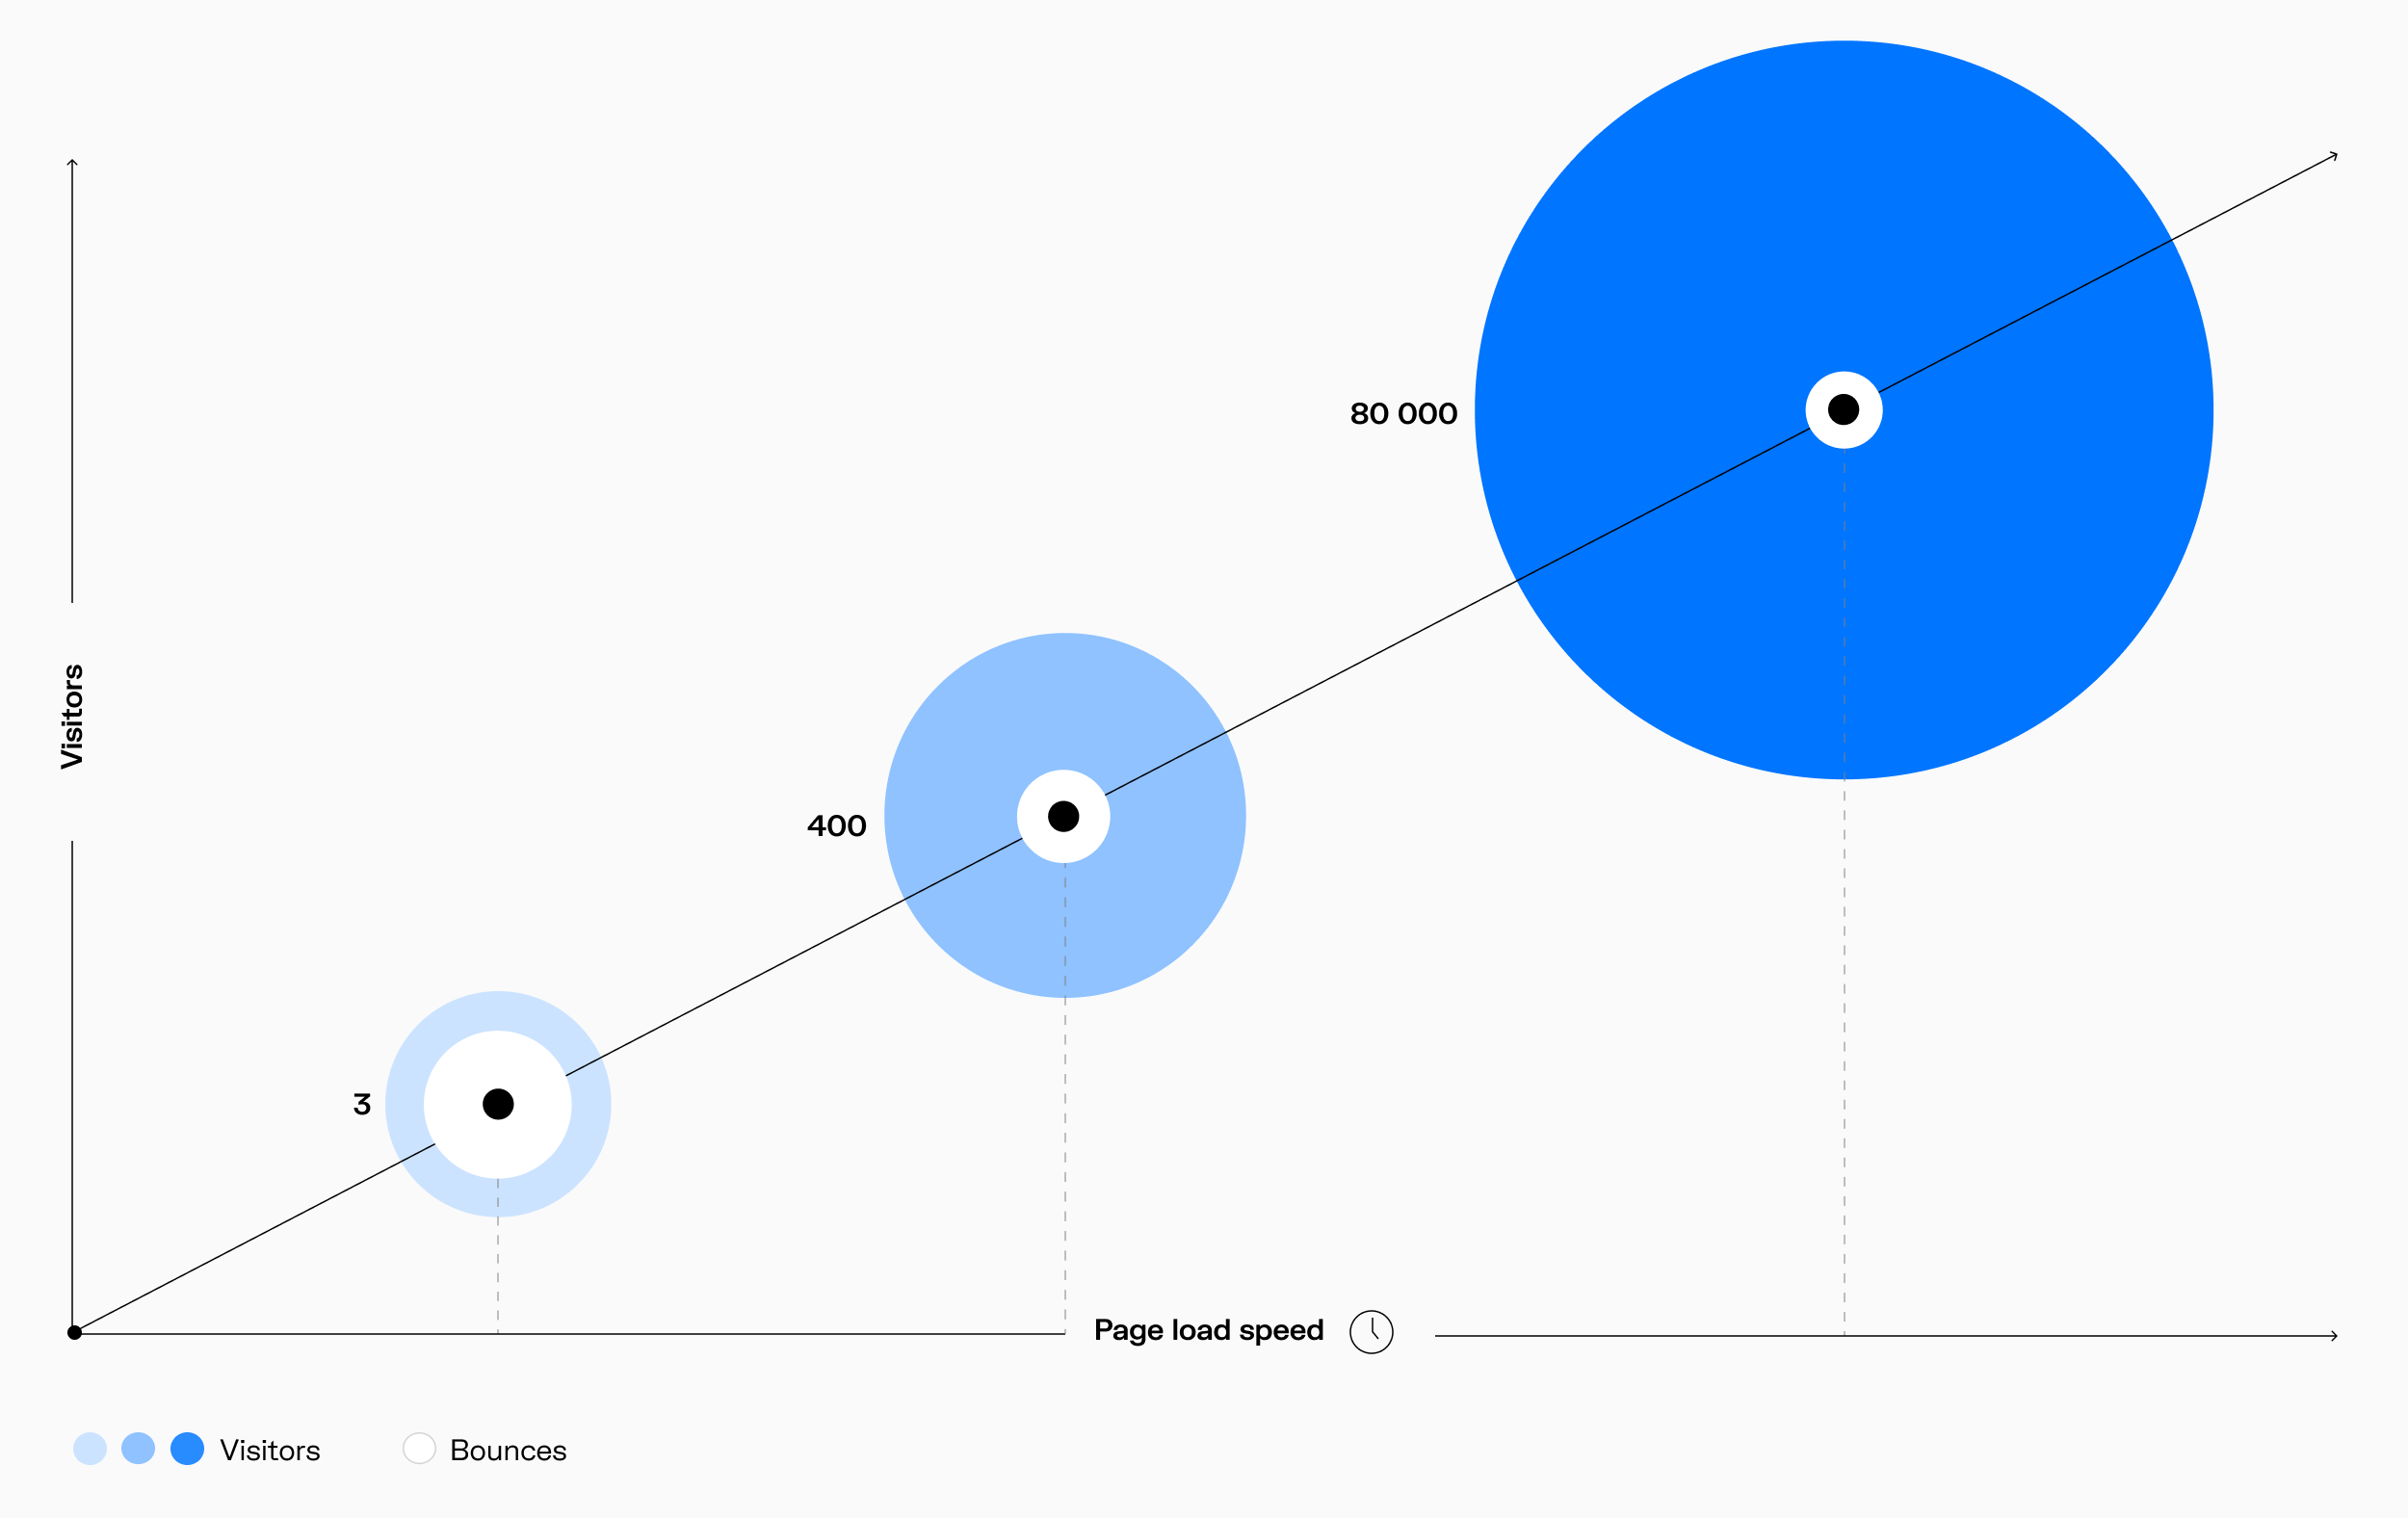 load speed and number of visitors correlation
 Bad experiences cost online retailers about $2.6 billion per year
SWEOR reports that retailers lose $2.6 billion every year because of CX issues. What’s interesting is that most of the issues are related to mobile experiences. If online retailers want to create a smooth customer journey across all devices, they should consider a page-loading time of 0.3 to 2.0 seconds as the current benchmark.
CX directly influences conversion, nps, aof, and more
A satisfying online customer experience affects your core business metrics in a number of ways:
👉 Streamlined web performance drives more visitors and fewer bounces to your site.
👉 Fewer bounces, together with better serving mobile customers and improving search visibility, grow market share.
👉 Polishing the experience at every touchpoint increases the number of positive word-of-mouth recommendations, which improves the NPS.
👉 NPS, in turn, correlates with AOF: the more shoppers come back, the higher their order frequency.
👉 A better online customer experience means having more shopping-related content consumed per session, hence a higher probability of purchase and increased AUB and ABV.
Those are just a few examples of how a good CX boosts your metrics. For more, download the full version of the report→
Mobile touchpoints are crucial — now more than ever
According to GSMA, 49% of the population is connected to the internet, while global mobile device penetration is over 70%.
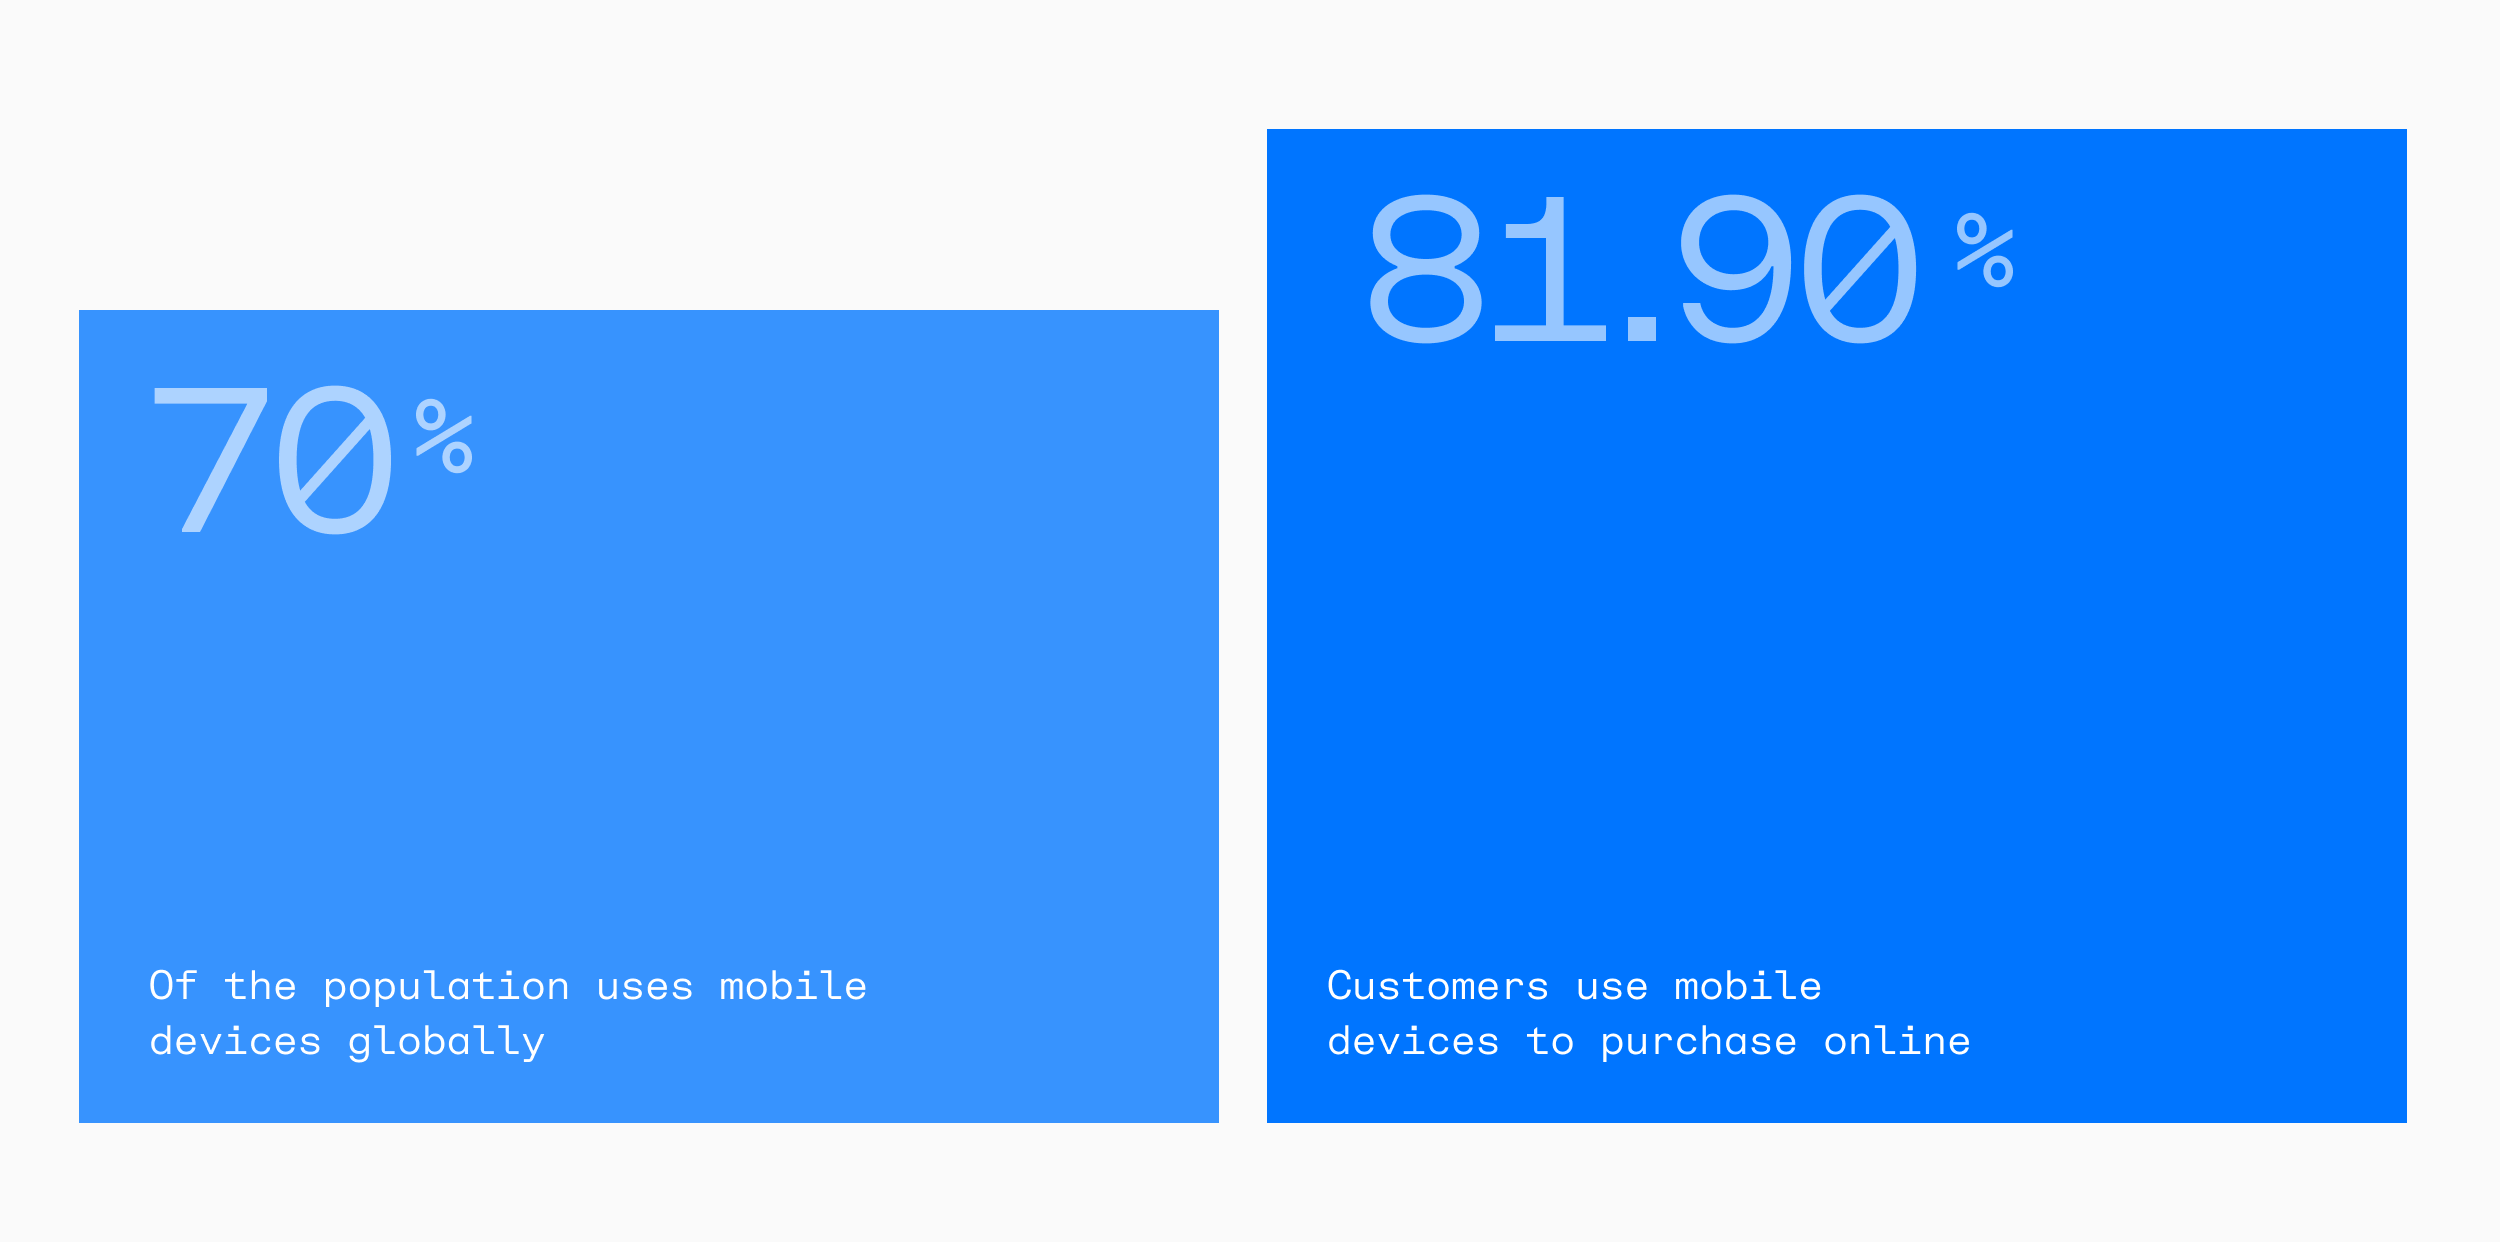 mobile device usage statistics
 For ASOS alone, the share of mobile device visits grew by 4.9% between 2018 and 2019, reaching an impressive 81.90%. What’s interesting is that only 52% of mobile internet users have access to 4G+ technology, which leaves the other half of the online retail audience with slow connections.
This brings a competitive edge opportunity for retailers: to optimize the mobile customer journey and serve lightweight yet engaging shopping-related content.
Images can be optimized by 86% without compromising visual quality
Images take up over 70% of catalog and product page bandwidth, and they account for roughly the same volume of CDN traffic. Image content can be optimized by up to 86% at minimal-to-zero loss in visual quality, and the decrease in CDN traffic volume and cost due to such optimizations can reach 92%.
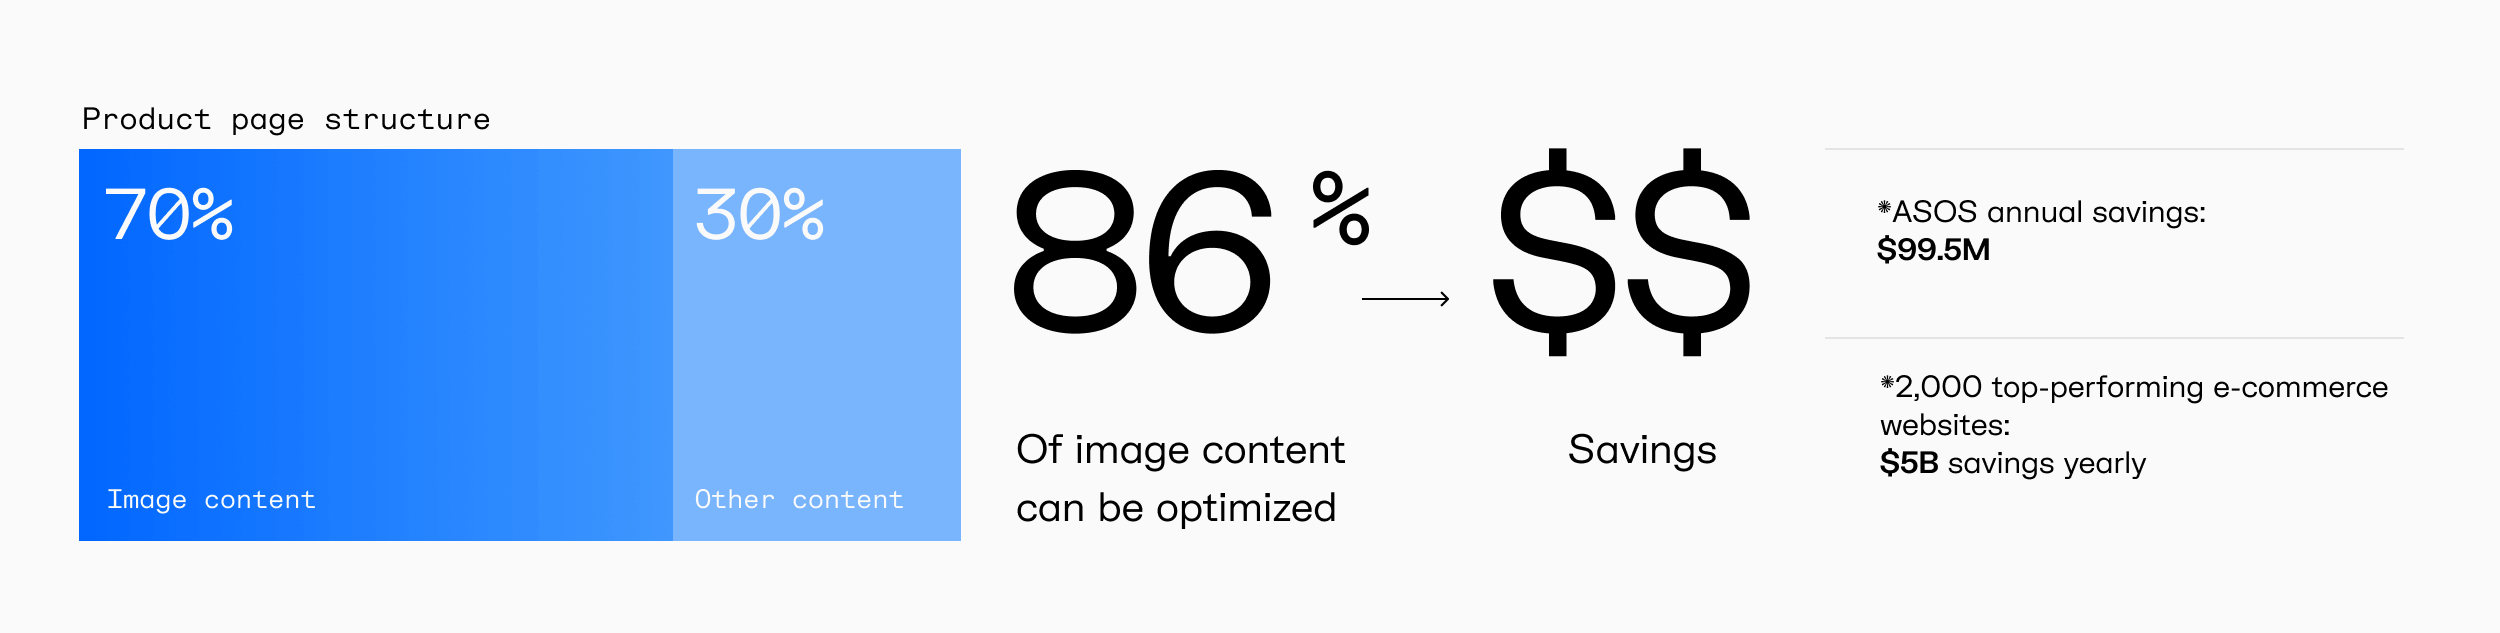.png) image optimization statistics
image optimization statistics Get your copy of the report
In the full version, you’ll find a detailed explanation of every statement made above — 23 PDF pages, about 17 minutes to read.