Previously in our Google Lighthouse series, we have already discussed website interactivity as represented by the Time To Interactive Lighthouse metric. In this article, we’re going to take a look at another related parameter: First Input Delay.
In the past, when network connections were slow, websites were meant mostly for computers, and people were more willing to wait an extra second to access the info they needed. Of course, devs back then were thinking of website performance (me included), but without unified tools to measure it.
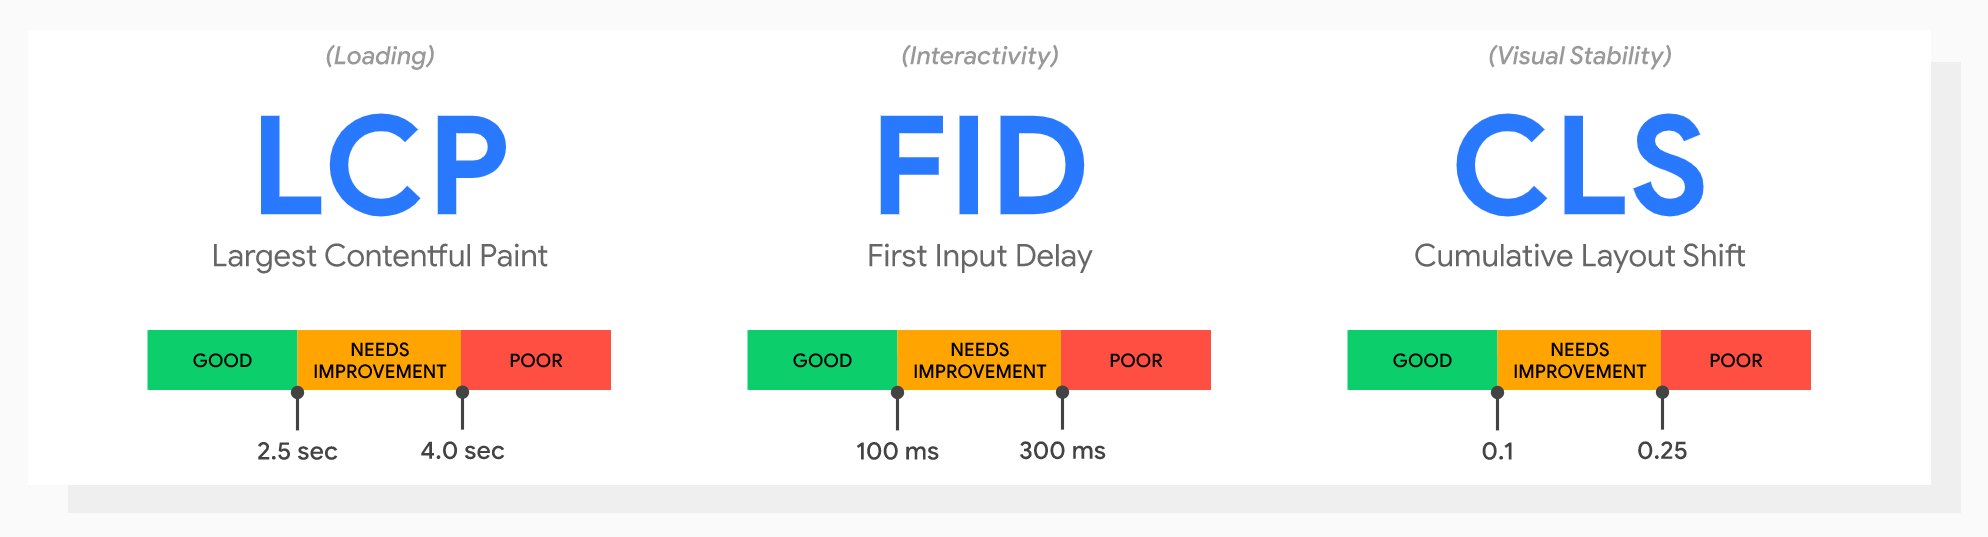
Now, in the age of high competition among websites, Google has introduced Core Web Vitals, a set of several performance metrics that at this moment (2021) represents three aspects of the user experience: loading, interactivity, and loading stability.
 The three pillars of modern web UX.
First Input Delay, or FID, measures the time it takes a page to start processing a user's first interaction with a page. This includes clicking a link, tapping a button, or custom JavaScript-driven events. However, scrolling and zooming are not considered a first interaction.
To provide a good user experience, a page should have a First Input Delay of 100 milliseconds or less. Core Web Vitals have a threshold of the 75th percentile of all page loads to meet this criterion for most of your users. However, they have a different way of measuring FID, so Google strongly recommends looking at the 95th-99th percentiles for this particular metric.
While most of the Lighthouse parameters can be measured “in the lab,” meaning that network/throttling/behavioral conditions can be emulated with software methods, First Input Delay is measured “in the field.”
This means that Google actually tracks the user’s interaction, measures the parameter, and sends it to platforms such as:
Field measurement is also a reason why you won’t find this metric listed in your local Lighthouse report, since Lighthouse is not an “in the field” tool. But there’s a Lighthouse metric that closely correlates with FID and is actually used for improving the latter. We will talk about this down the road.
Websites load in parts. The browser takes its time to load HTML code, fetch CSS and JavaScript files, parse them and evaluate scripts. Some of these tasks block the browser's main thread, making it unresponsive to the user’s input until a particular parsing/evaluating task is finished.
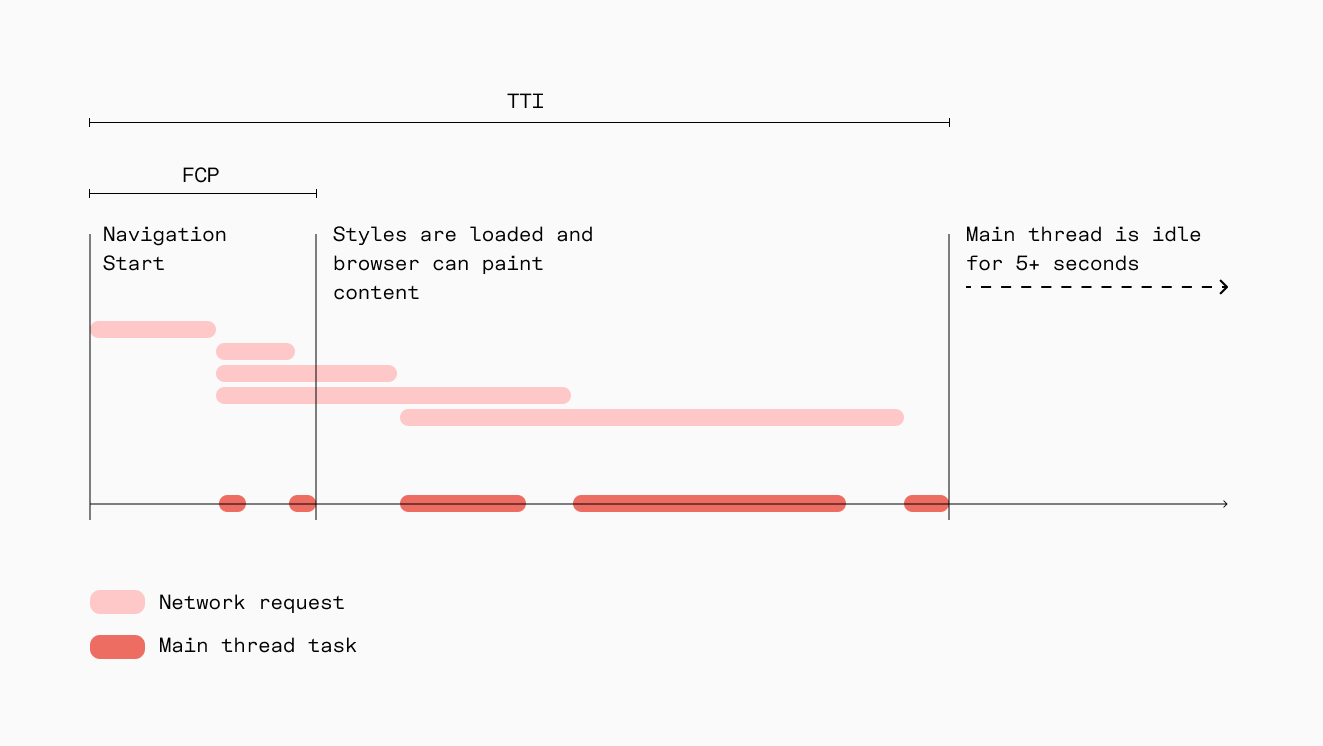 The tasks marked in red are blocking the main thread and making the browser unresponsive to user input.
In the example above are some JavaScript tasks that are blocking the main thread. There are many things that can cause this issue. I once had a situation where a script that initialized a hidden form in a modal window caused very long tasks.
If the user tries to interact with the page when a task is in progress, here is what happens:
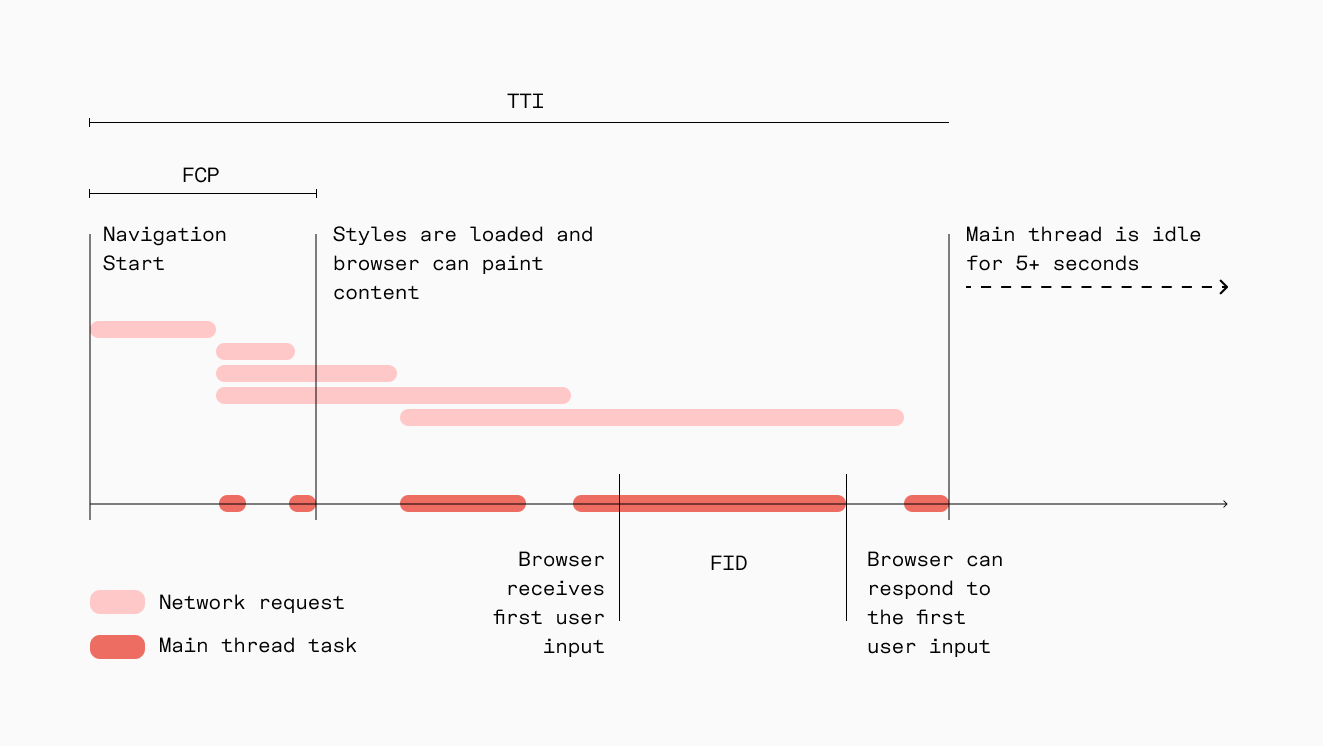 A visual representation of FID.
The browser will first finish the current long task that’s blocking the main thread, and then react to the user's input. This time span is marked as FID in the image above.
It’s true that event processing time and UI update do impact user experience. However, taking those into account when measuring FID may lure some developers into excessive use of asynchronous processing, which may improve the score but, in fact, harm the experience.
FID is not all about JavaScript. This parameter measures the time between an input received and the main thread’s next idle. As an example, these element types still require an idle main thread even if there are no event listeners attached to them:
- Input fields (
<input>, <textarea>), radio buttons and checkboxes
- Dropdowns (
<select>)
- Anchor links (
<a>)
Since this is real-world data, chances are you may encounter low, zero, or even very high values for the same page. This is because some users won’t even interact with the website directly; they may just scroll and zoom the page (these are not tracked as mentioned earlier). Also, some interactions may happen at the worst time, when the biggest task has just started, so the visitor's browser will have to wait for the whole task to complete instead of a part of it.
This makes the analysis part of optimization slightly different from usual Lighthouse values. We will talk about this later in the section A Note on Analyzing FID Data.
To manually measure First Input Delay, you can use the Web Vitals Javascript library. Here’s a snippet of code that utilizes it:
<!DOCTYPE html>
<html lang="en">
<head>
<meta charset="UTF-8">
<meta http-equiv="X-UA-Compatible" content="IE=edge">
<meta name="viewport" content="width=device-width, initial-scale=1.0">
<title>Document</title>
</head>
<body>
<h1>
Long Task FID Test
</h1>
<input type="text" placeholder="Type here...">
<script type="module">
import { getFID } from 'https://unpkg.com/web-vitals?module';
getFID(console.log);
</script>
<script>
for (let i = 0; i < 2000000000; i++) {
}
</script>
</body>
</html>
This code will report the First Input Delay once it happens. Let’s take a look at the Performance tab in Chrome DevTools first and see if we have a long enough task to test:
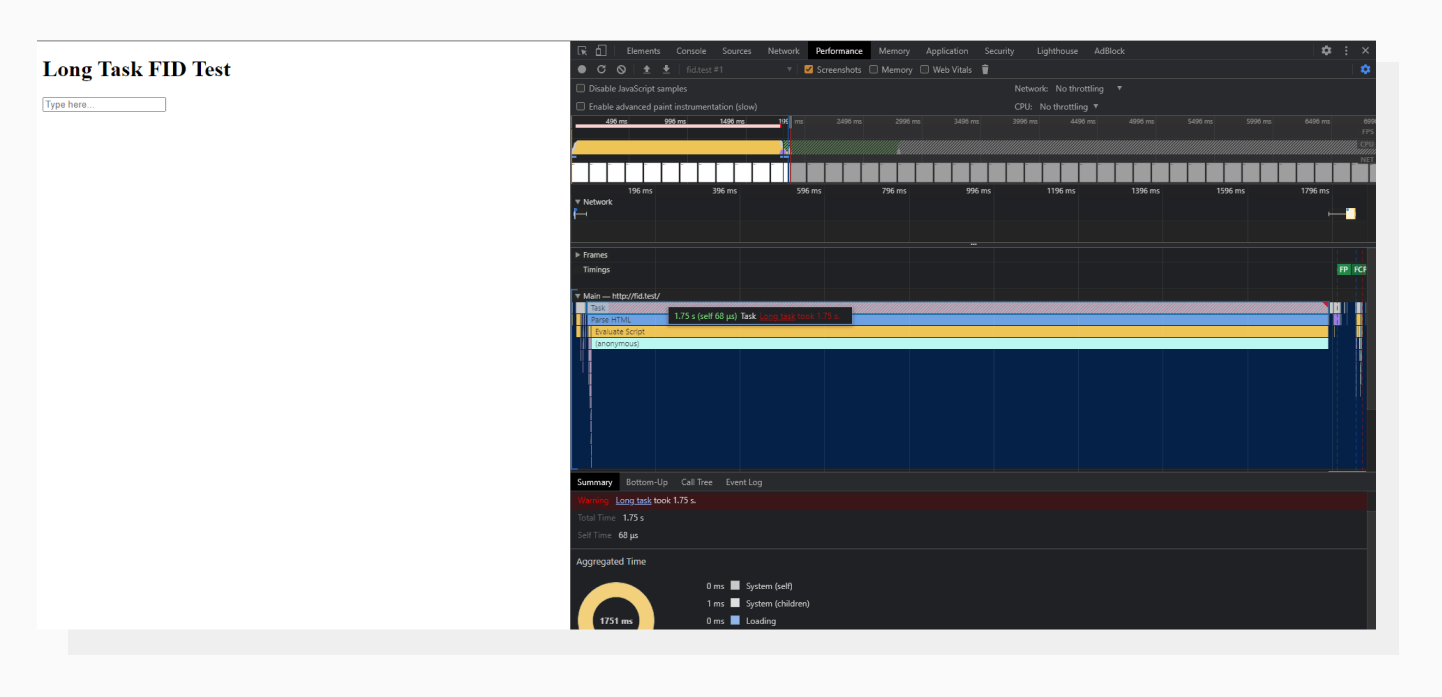 This is considered a long task. The main thread is blocked for 1.75 seconds.
If we try to interact with the page while the main thread is busy, the code will wait for it to become idle and report the value to the console. To test it, let’s click the input field right after it appears. This is usually the case for people who want to get info on the website ASAP.
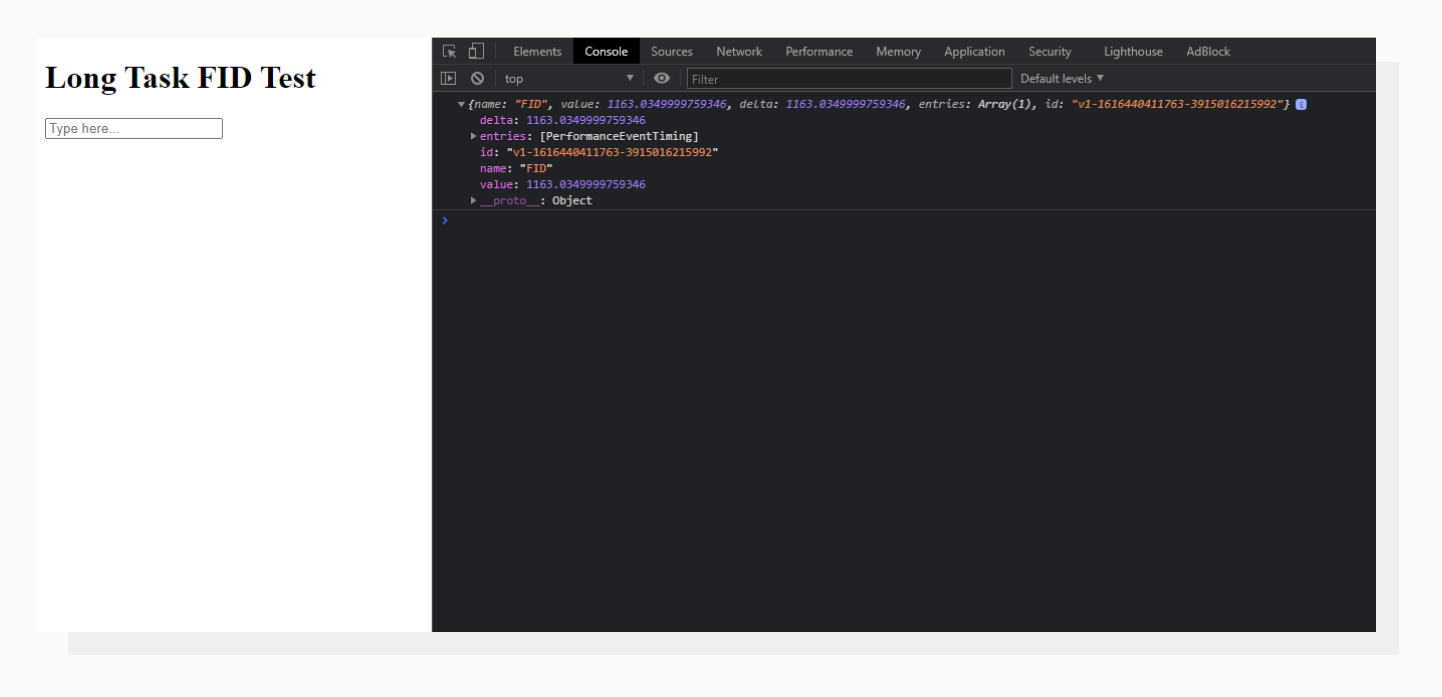 The library prints an object to the console.
The FID in this particular case is 1163 milliseconds. If we open the same page, scroll for a while and then activate the field, here’s what happens:
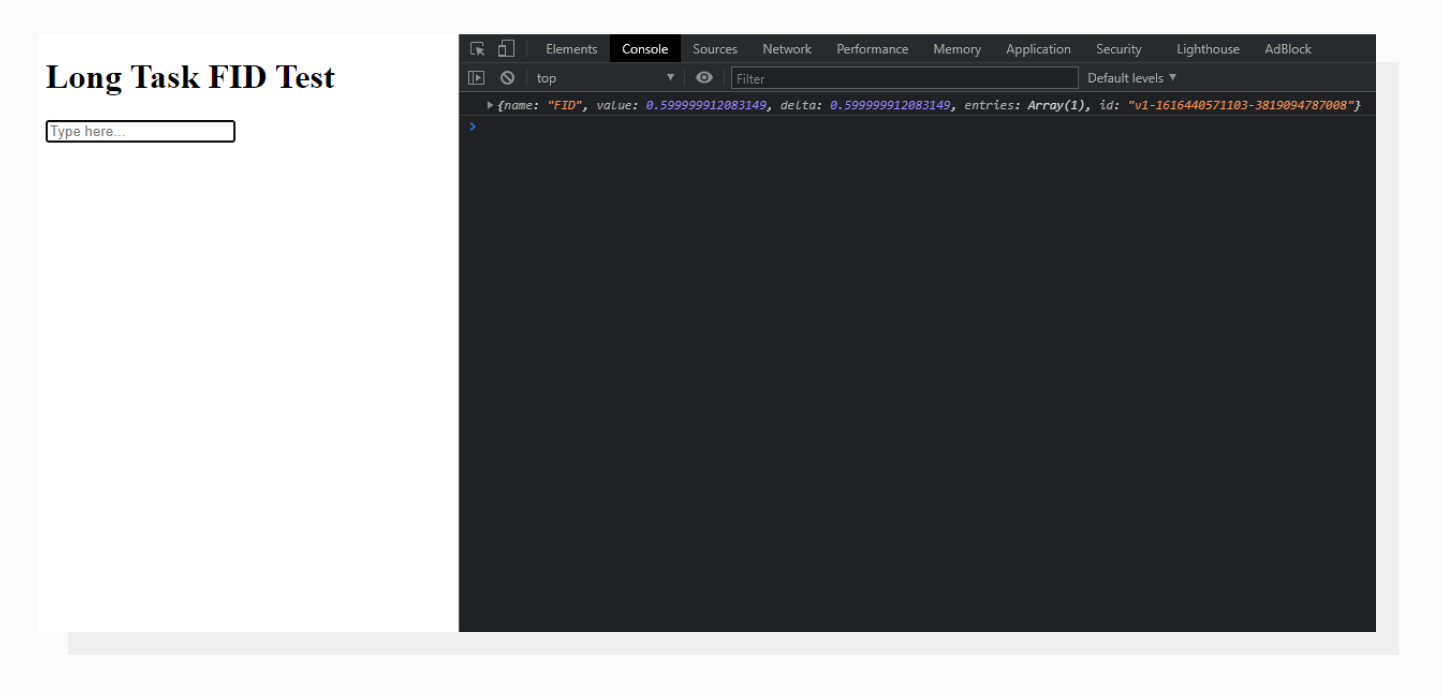 The value is not that big this time.
In this case, the long task has finished and the interaction is handled almost immediately, since there were no scripts keeping the main thread busy this time.
If you want to dive deep into analyzing the data using your own tool, it’s possible to send values to a certain endpoint. To do that, modify the script to look like this:
<!DOCTYPE html>
<html lang="en">
<head>
<meta charset="UTF-8">
<meta http-equiv="X-UA-Compatible" content="IE=edge">
<meta name="viewport" content="width=device-width, initial-scale=1.0">
<title>Document</title>
</head>
<body>
<h1>
Long Task FID Test
</h1>
<input type="text" placeholder="Type here...">
<script type="module">
import { getFID } from 'web-vitals';
function sendToAnalytics(metric) {
const body = JSON.stringify({ [metric.name]: metric.value });
(navigator.sendBeacon && navigator.sendBeacon('/analytics', body)) ||
fetch('/analytics', { body, method: 'POST', keepalive: true });
}
getFID(sendToAnalytics);
</script>
<script>
for (let i = 0; i < 2000000000; i++) {
}
</script>
</body>
</html>
This will pass serialized data to the endpoint you define in place of the /analytics placeholder.
The same thing is possible with Google Analytics. You can get detailed info on this Chrome GitHub page.
Due to the field nature of First Input Delay, values may vary drastically, so in order to get a good score on this metric, it’s important to focus on getting a higher percentile, even if it’s already enough to meet the “75th percentile” criterion mentioned by Google.
Doing that will bring reports of particularly bad first user experiences to the surface, and you’ll be able to take action based on this data. In the absence of a “statistically average user,” working with a distribution is even more important.
Previously, I mentioned that there’s a Lighthouse metric which can help improve FID. This metric is called Total Blocking Time (TBT). It serves as a great lab proxy when optimizing First Input Delay.
TBT measures the total amount of time between First Contentful Paint and Time To Interactive, when the main thread is blocked for long enough to break the perception of website responsiveness. It monitors all tasks that are longer than 50 milliseconds and sums up everything above the 50-millisecond threshold.
Therefore, the key to improving FID would be the same as for improving TBT. Let’s walk through the steps.
Code provided by external services such as social media, A/B testing, and analytics is called third-party code. In modern web development, they play a significant role when it comes to optimizing JavaScript.
You can find detailed info on which third-party scripts affect your page loading process in the corresponding Lighthouse report section.
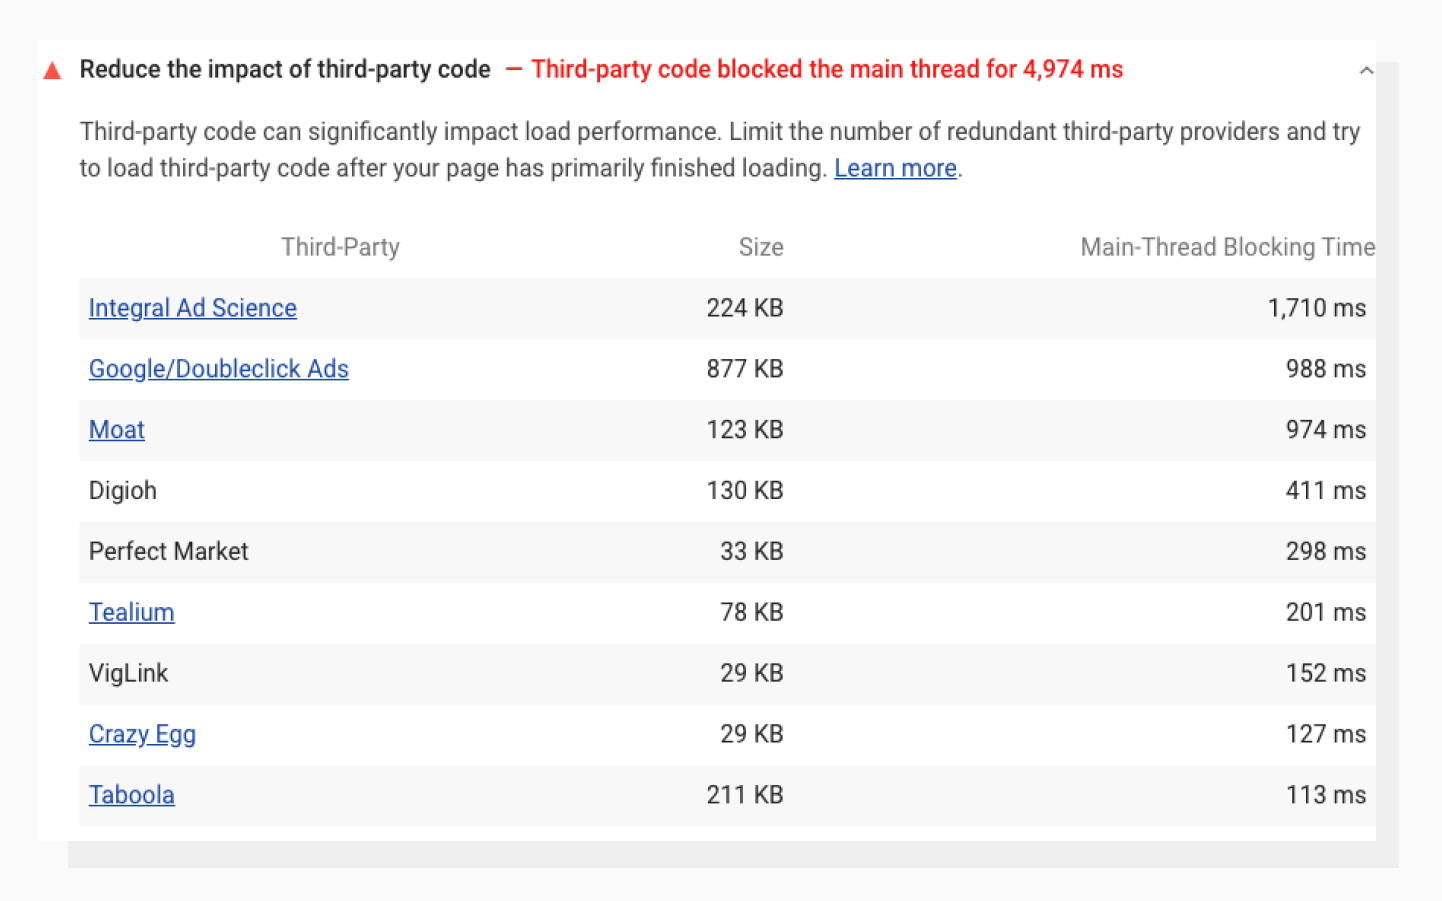 Network and Script Evaluation aspects of third-party code.
Examine your code to find bottlenecks. Is there anything that’s resource hungry, but not so critical that it can’t be postponed or removed from the critical path? This can include initializing content inside modals or working with elements that are not yet within the viewport.
Utilizing best practices of code splitting usually leads to drastic improvements in TBT and FID. If you don’t know where to start, use the advice above as a starting point.
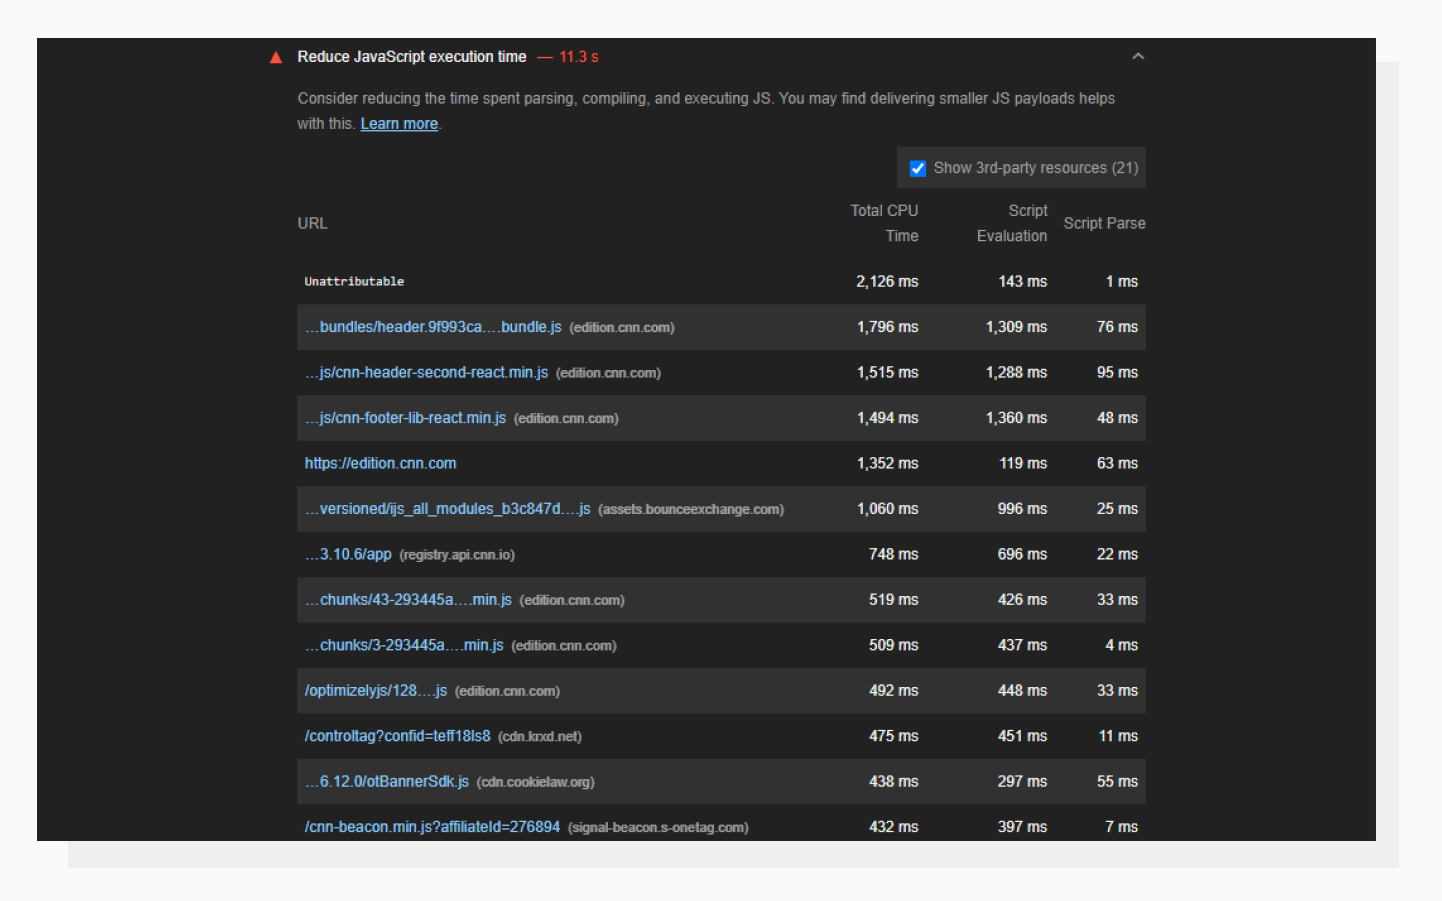 Here, you can find which scripts are causing issues.
Lighthouse also tracks how many requests are made and how data-heavy the responses transferred over the network are. Here’s an example:
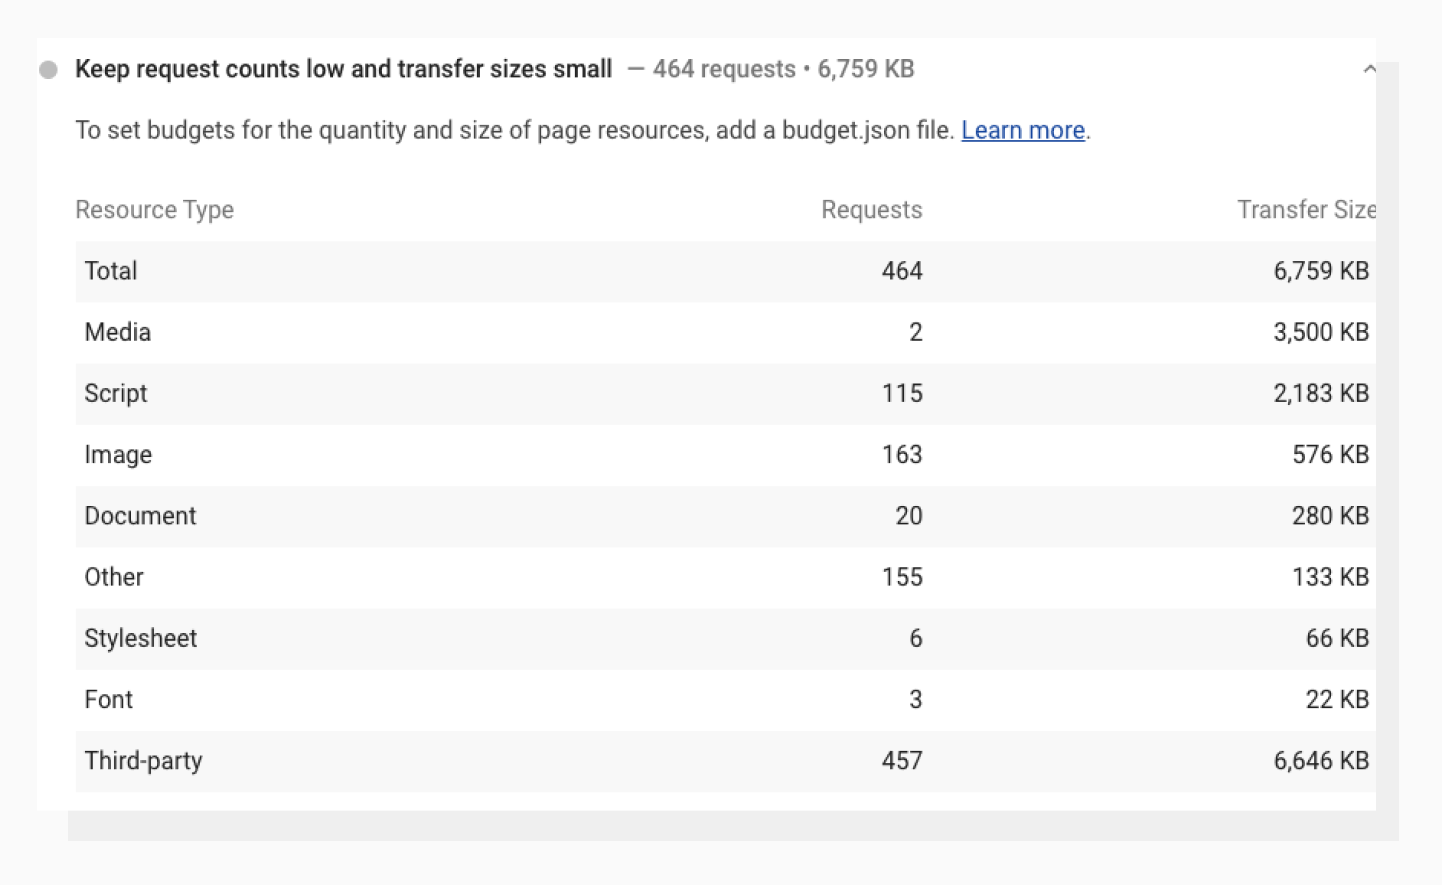 A detailed breakdown of resources that are pulled by the page.
In this particular case, if your scripts are render-blocking and not optimized, browsers will have to wait for a script to load in order to execute it and continue page rendering. Initializing a new request also takes time to prepare, so it’s important to seek balance and not oversplit the code.
In the last example, you can see that images are responsible for 163 requests and 576 KB of data. While the image loading process doesn’t make the page unresponsive by itself, it takes up valuable bandwidth, leaving less room for actual bytes of code to transfer to the user's device. This is why I’d recommend keeping images optimized and lazy-loaded.
To accomplish this, Uploadcare developed a tool called Adaptive Delivery. It makes it easy to:
- Automatically lazy load images (load them on demand);
- Apply image transformations on the fly;
- Optimize image size, format, dimensions and quality based on the visitor’s device’s capabilities.
The last one is very beneficial, since you won’t need to prepare lots of different image versions in advance.
It’s provided in the form of a tiny JS script (3.7 KB) that takes care of all image-related heavy lifting on the front end. For example, if you have a 10 MB image as the only image version, the script will compress it automatically for mobile visitors.
To see how big the network savings can be, use PageDetox. In a nutshell, it crawls all images from the page, evaluates them using Adaptive Delivery, and generates a report.
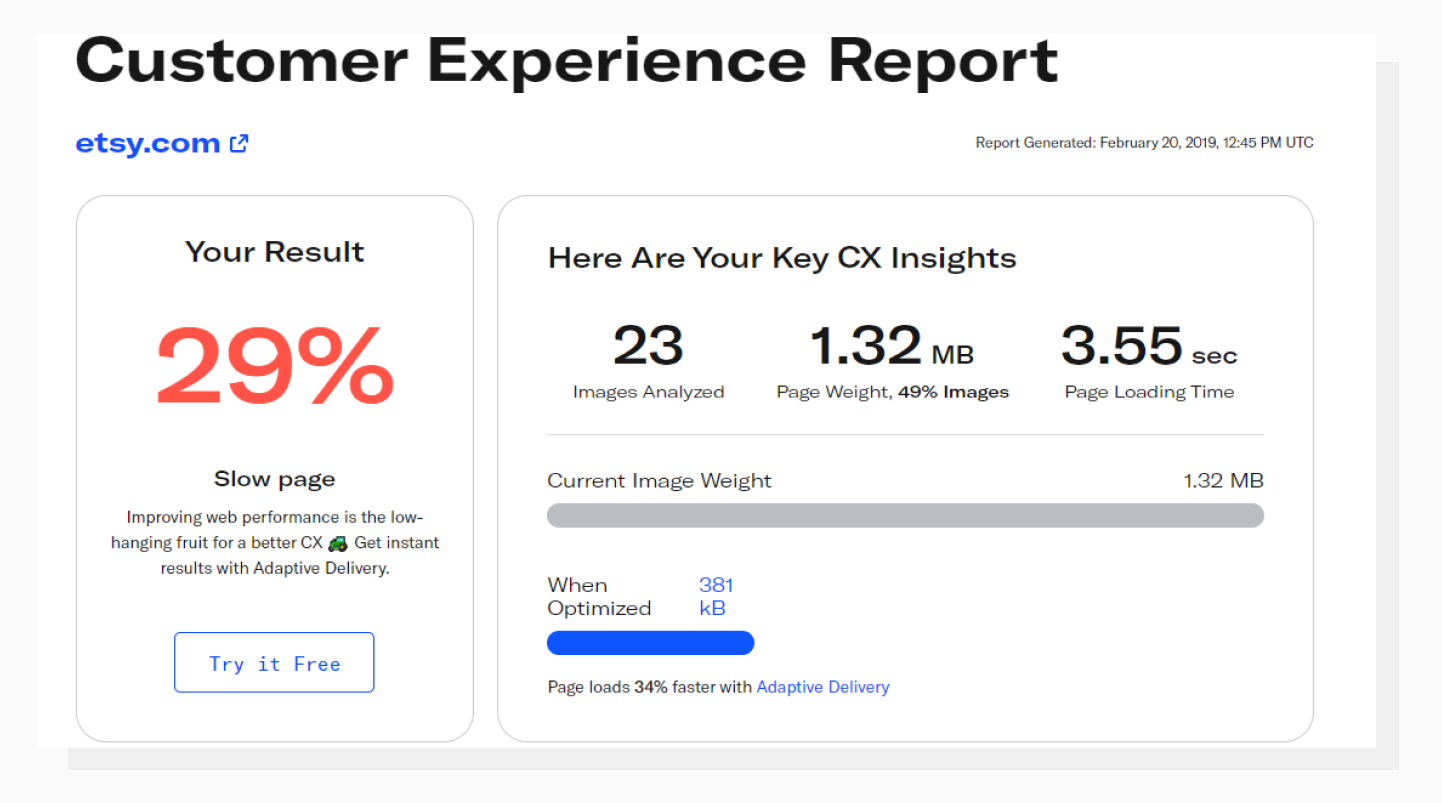 PageDetox tells you how fast your website can be if you use Adaptive Delivery.
It’s important not to see website optimization as a pure numbers game. Google uses metrics like FID as a way to help websites improve user experience, not sacrifice it for the sake of milliseconds. Rarely would you see First Input Delay increasing without improving other values such as FCP, LCP, etc. A systematic and user-centric approach is a good strategy for achieving long-term success.