Nowadays, it's more important than ever to make your website content easily visible, accessible and convenient to work with. In this article, we’re going to discuss what Google Lighthouse is and what you can get from using this tool.
Google Lighthouse is an automated tool that can help you improve your website. It has a set of audits: performance, accessibility, PWA (progressive web apps), SEO and more. You can run the tool on any web page and see how it performs.
When the tool finishes analyzing a web page, it returns a report with the calculated scores for each metric, a list of problems with the page, and general, or sometimes specific, recommendations regarding solving those problems.
Before we dive into how to run the tool, let’s talk about the scoring and metrics first.
Lighthouse scoring
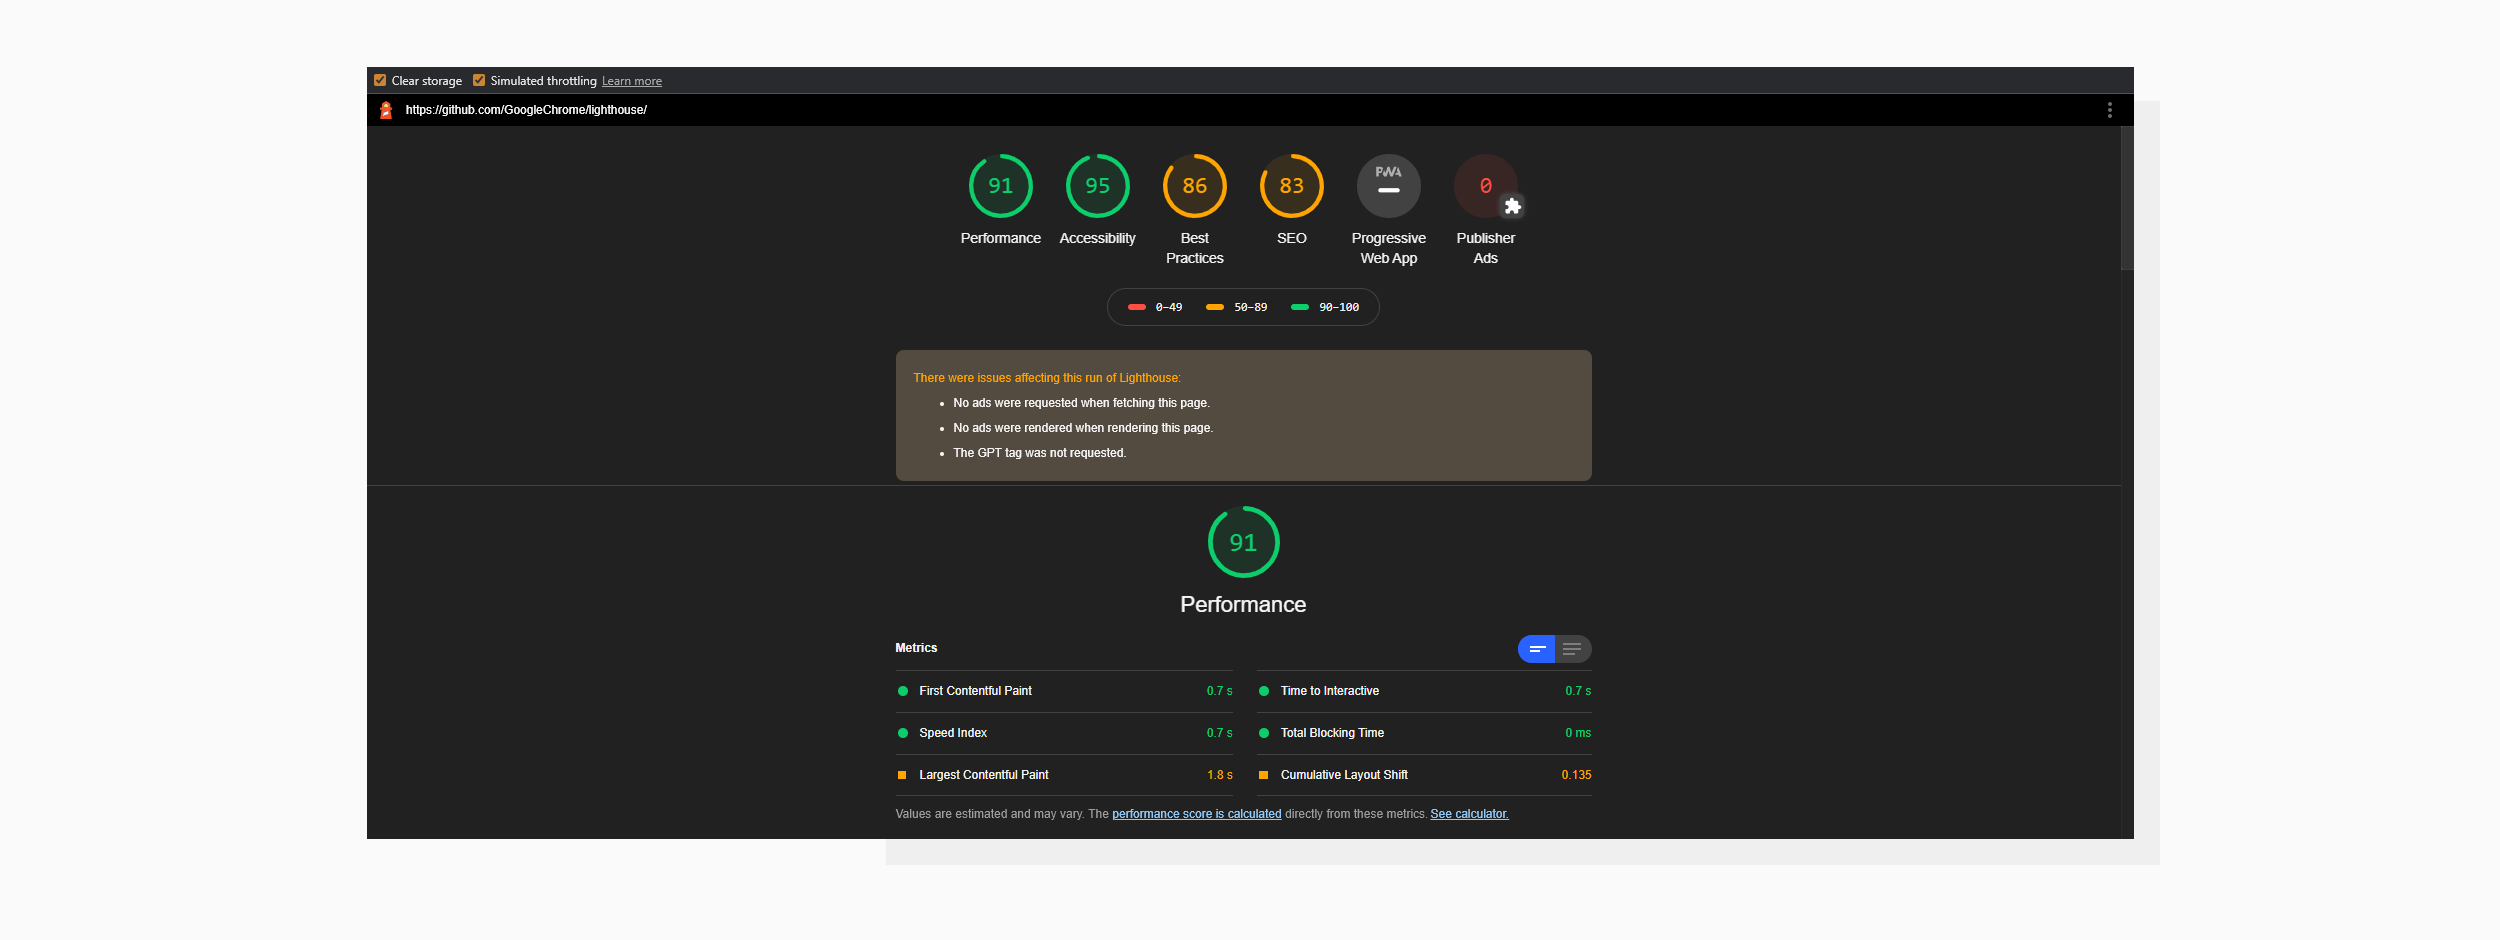
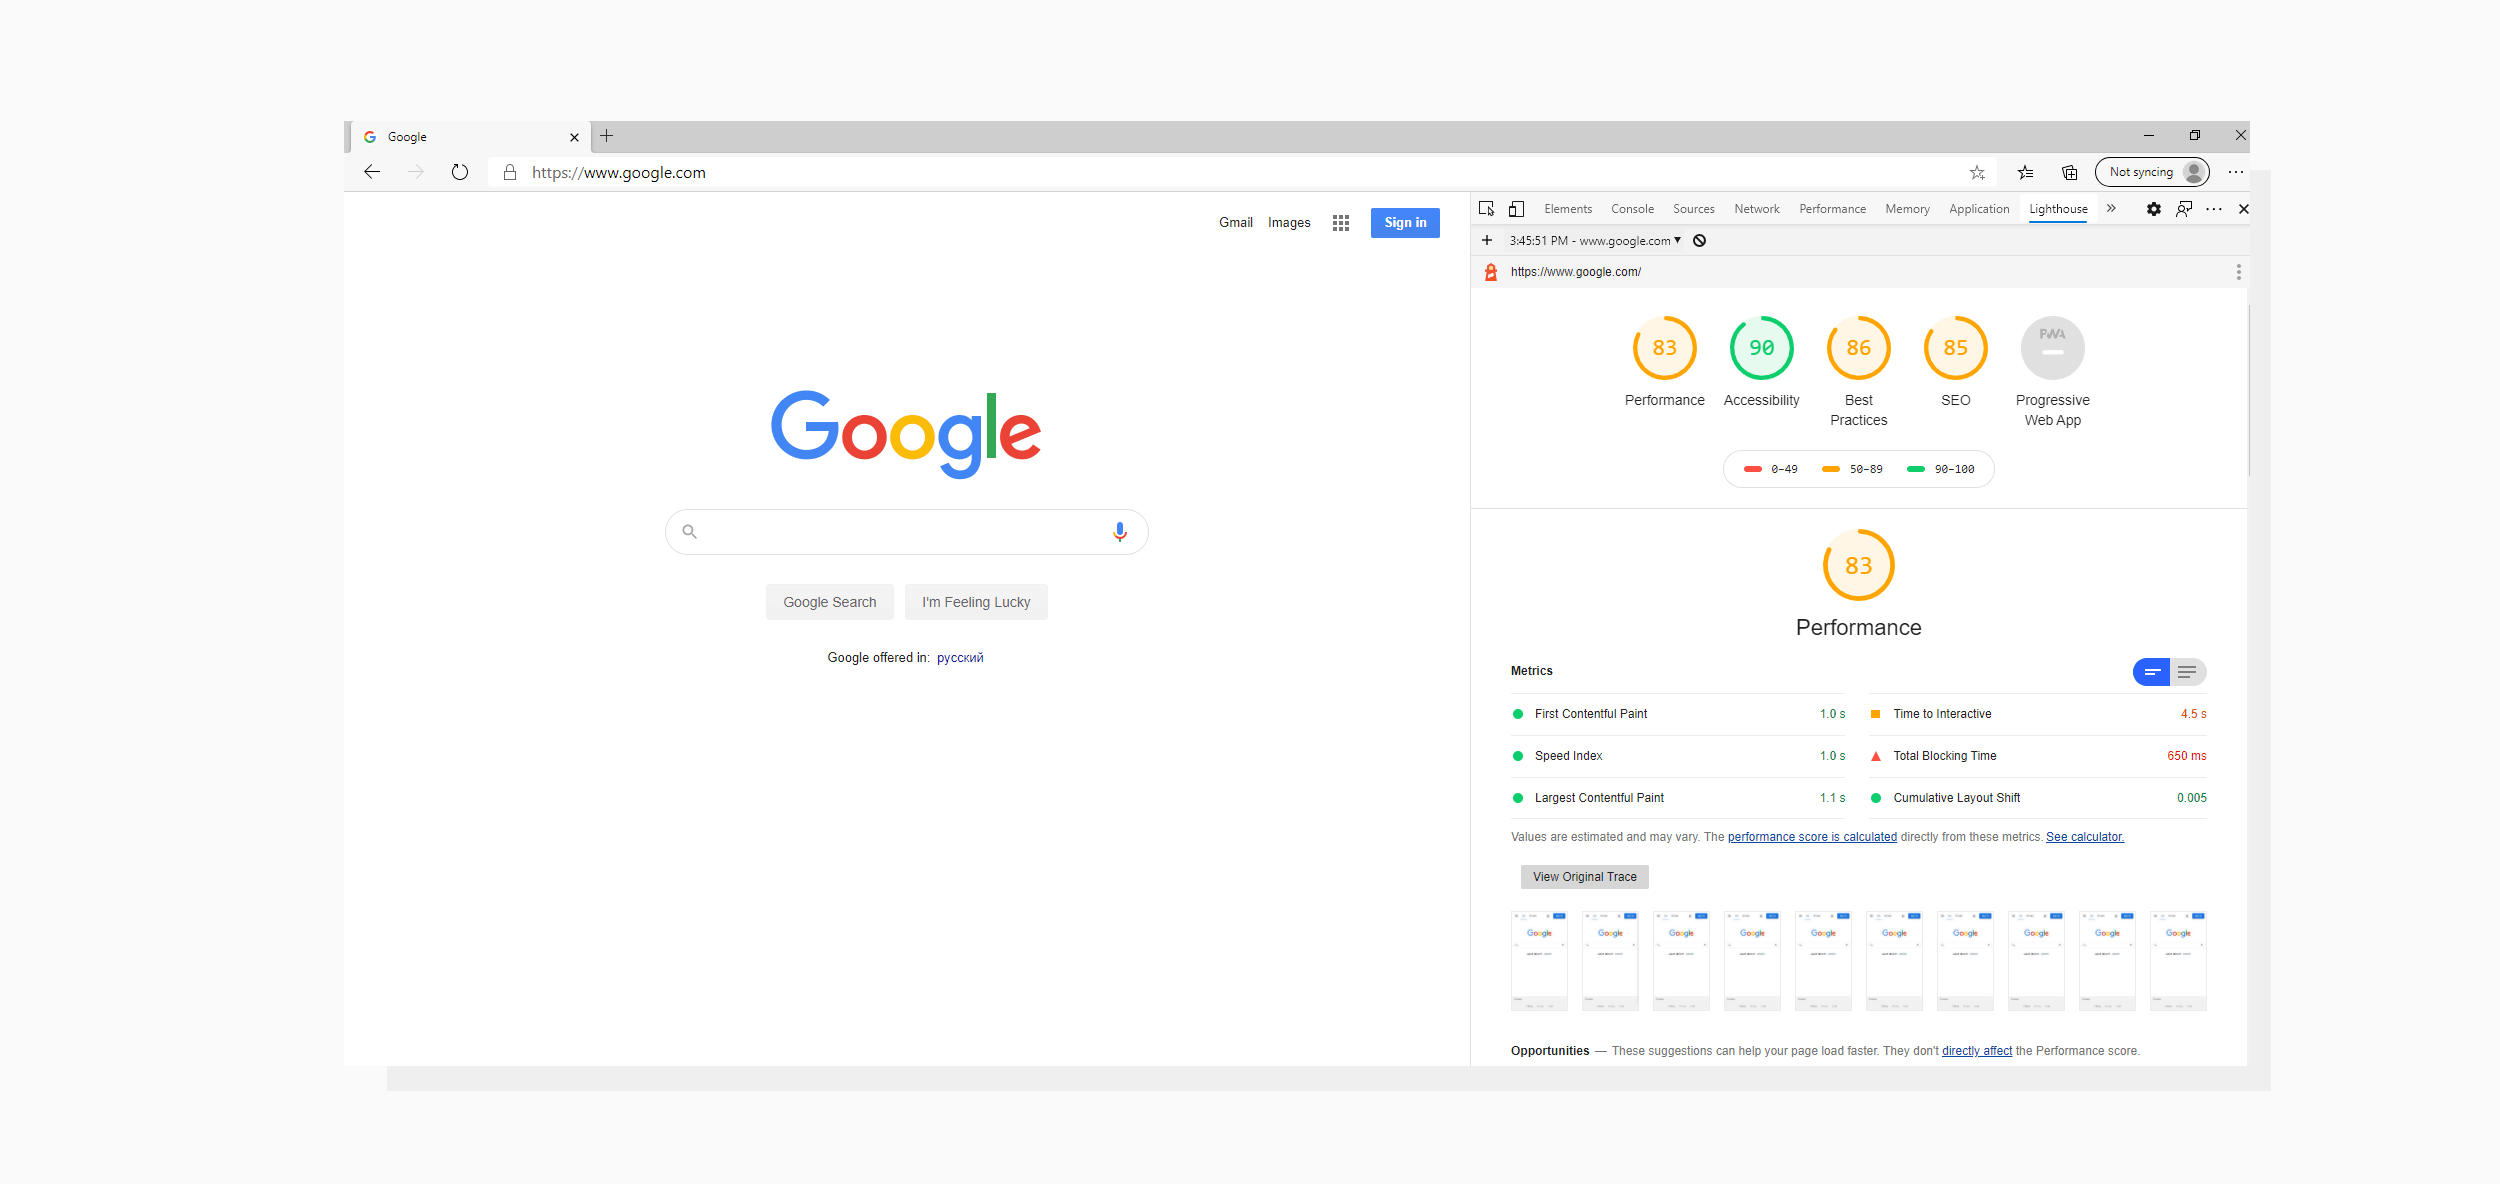
The screenshot below demonstrates the first thing you see once an audit is finished.
An audit run on the github.com main page.
This is often referred to as a Lighthouse score (or “scores” when talking about all the categories). From my experience, when people come to a web developer and say something like:
“I need to increase my Lighthouse score,” or
“I need to increase my PageSpeed score,”
they’re usually referring to the Performance category, unless they explicitly state otherwise. If you’re wondering what PageSpeed is, then stay tuned; we’ll discuss that later in the article.
Lighthouse performance metrics
“Okay, so the higher the scores are, the better the page is,” you may be thinking. And that’s mostly true. Let’s walk through the categories to explore the meaning of each.
Performance
This category has metrics that together reflect how fast your page is perceptually. I can’t stress this enough: your visitors will judge a page by the speed and responsiveness they feel it has, not by a stopwatch measuring the time waiting for the first image to appear on the screen.
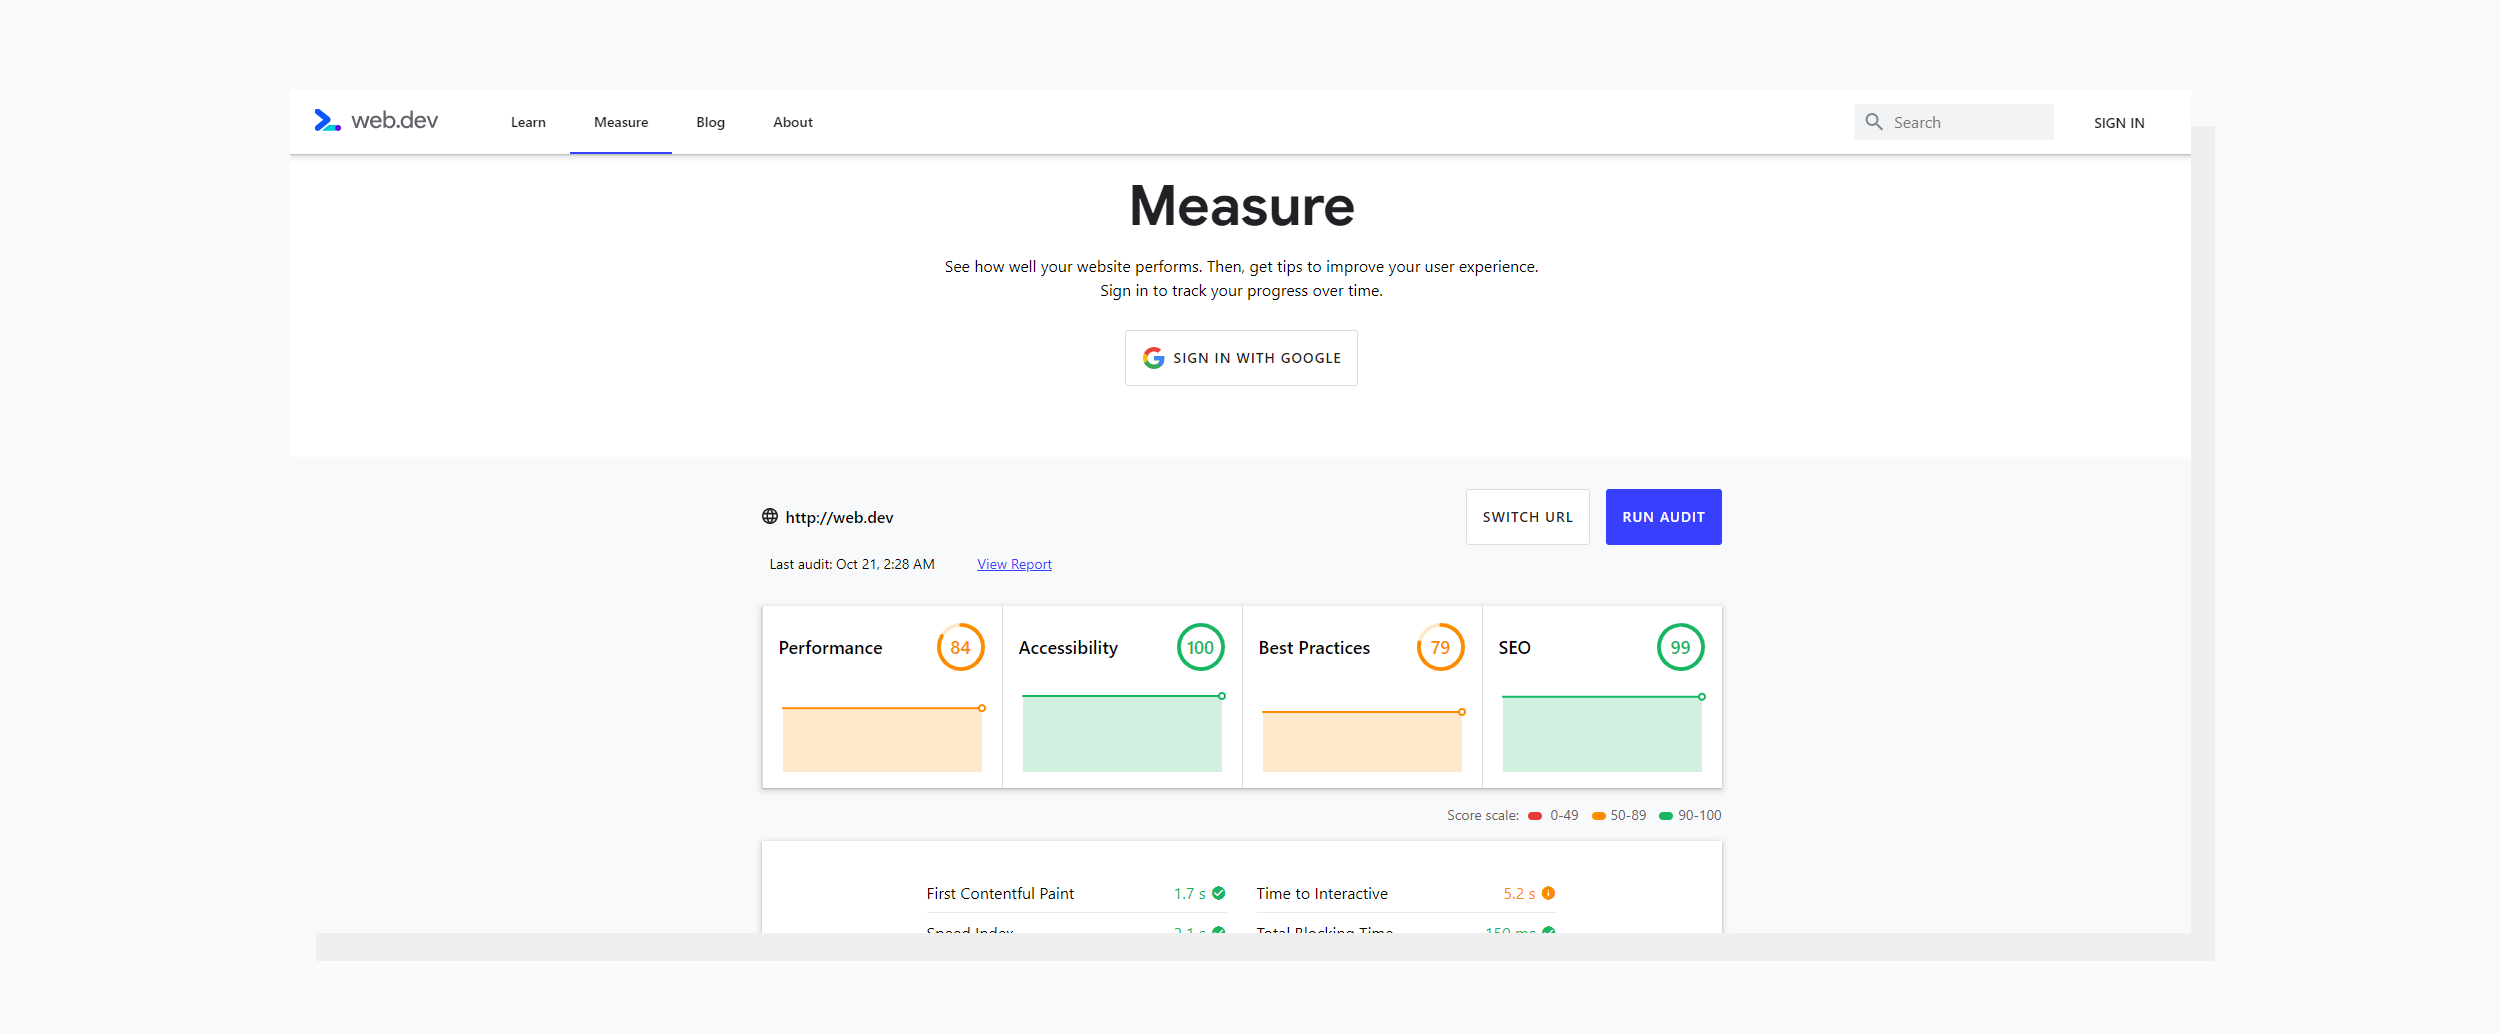
Here’s a list of those metrics and their weights in the Performance score:
First Contentful Paint — 15%
Speed Index — 15%
Largest Contentful Paint — 25%
Time to Interactive — 15%
Total Blocking Time — 25%
Cumulative Layout Shift — 5%
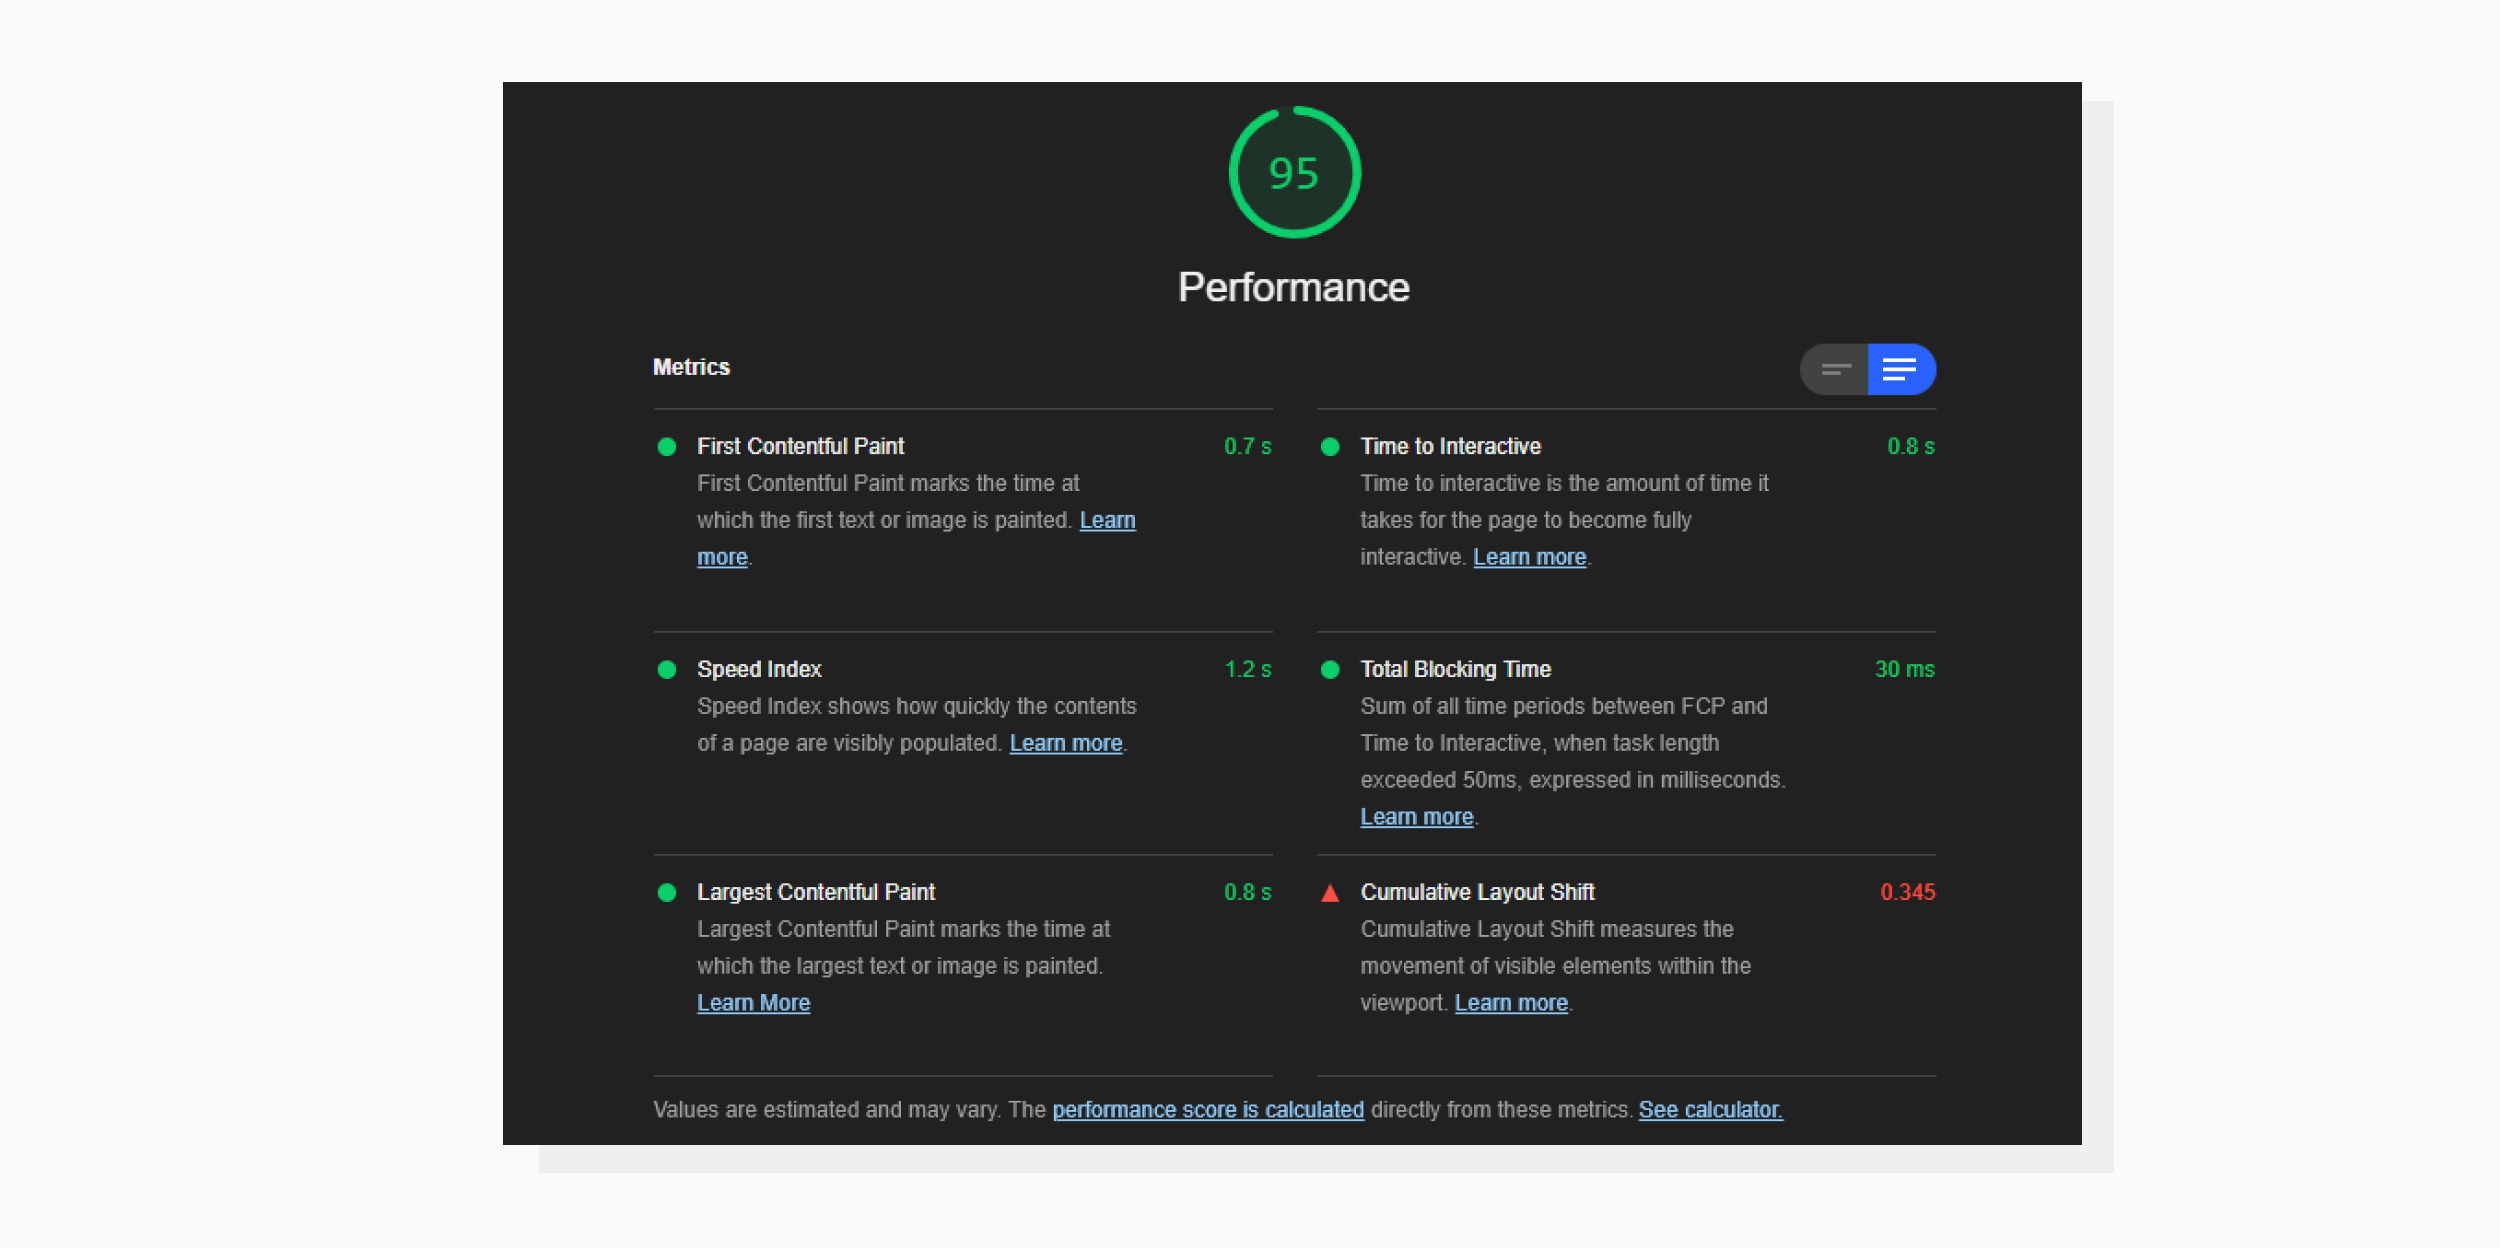
A test run on web.dev with descriptions.
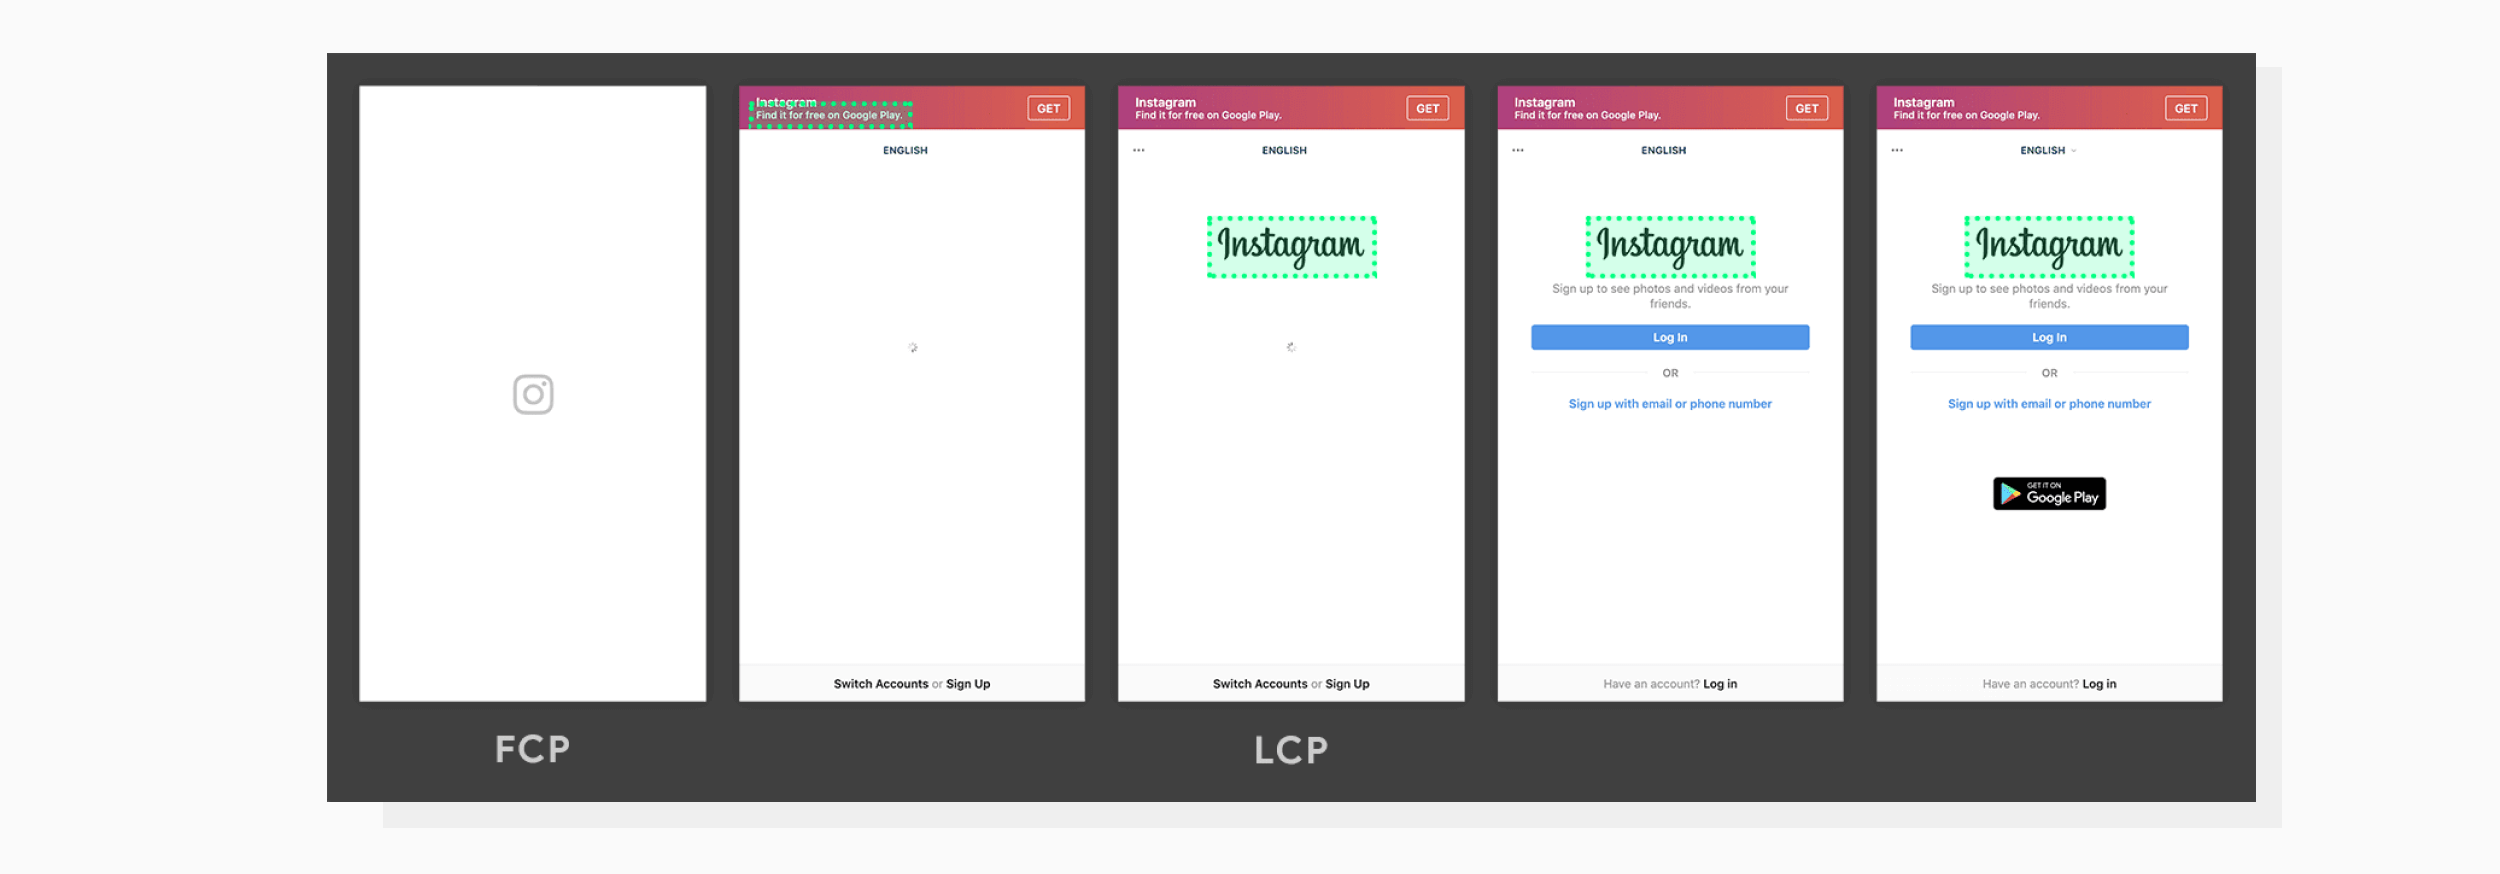
First Contentful Paint
Often called an FCP, this metric shows how long it takes for a browser to render DOM content. In this case, DOM content is text, images, non-white <canvas> elements and SVGs. It’s crucial to understand that this metric displays render time, not loading time. E.g., if a browser has loaded a particular text but the font is still on its way through the network, then it's still not considered a contentful paint.
Lighthouse calculates a score for this metric by comparing your page with the FCP data present in HTTP Archive. The tool uses a color-coding system to display how well a page performs according to a particular metric. A circle near the metric could be red, orange or green: slow, moderate or fast, respectively. Here's the interpretation:
FCP time under 2 seconds — green, fast
FCP time from 2 to 4 seconds — orange, moderate
FCP time over 4 seconds — red, slow
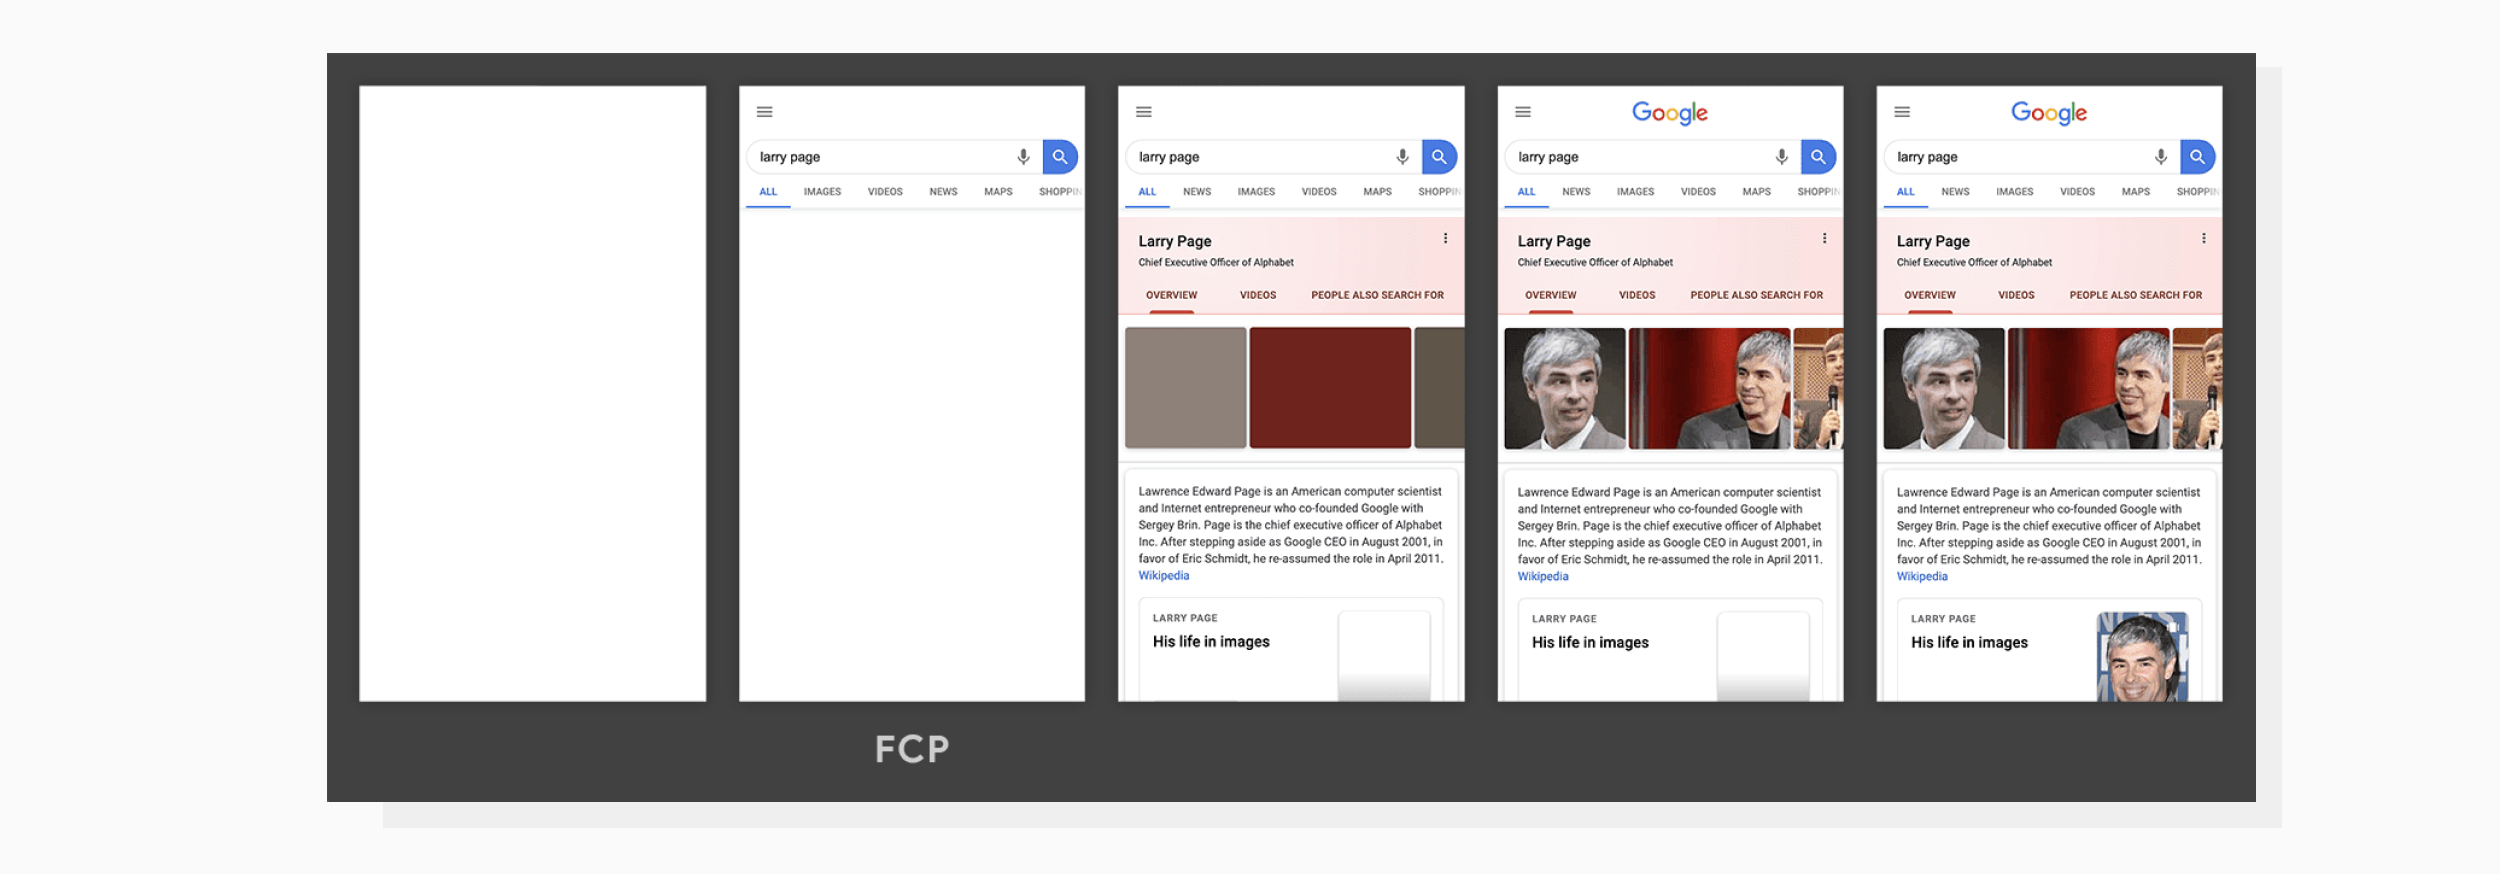
A screenshot sequence demonstrating an FCP. Image by web.dev
Speed Index
This shows how quickly the contents of a page load visually. To do this, Lighthouse records a video of your page loading and then computes a visual progression between frames. Hence, if your page elements display quickly (but there still could be scripts loading in the background), then this metric would be in the safe zone.
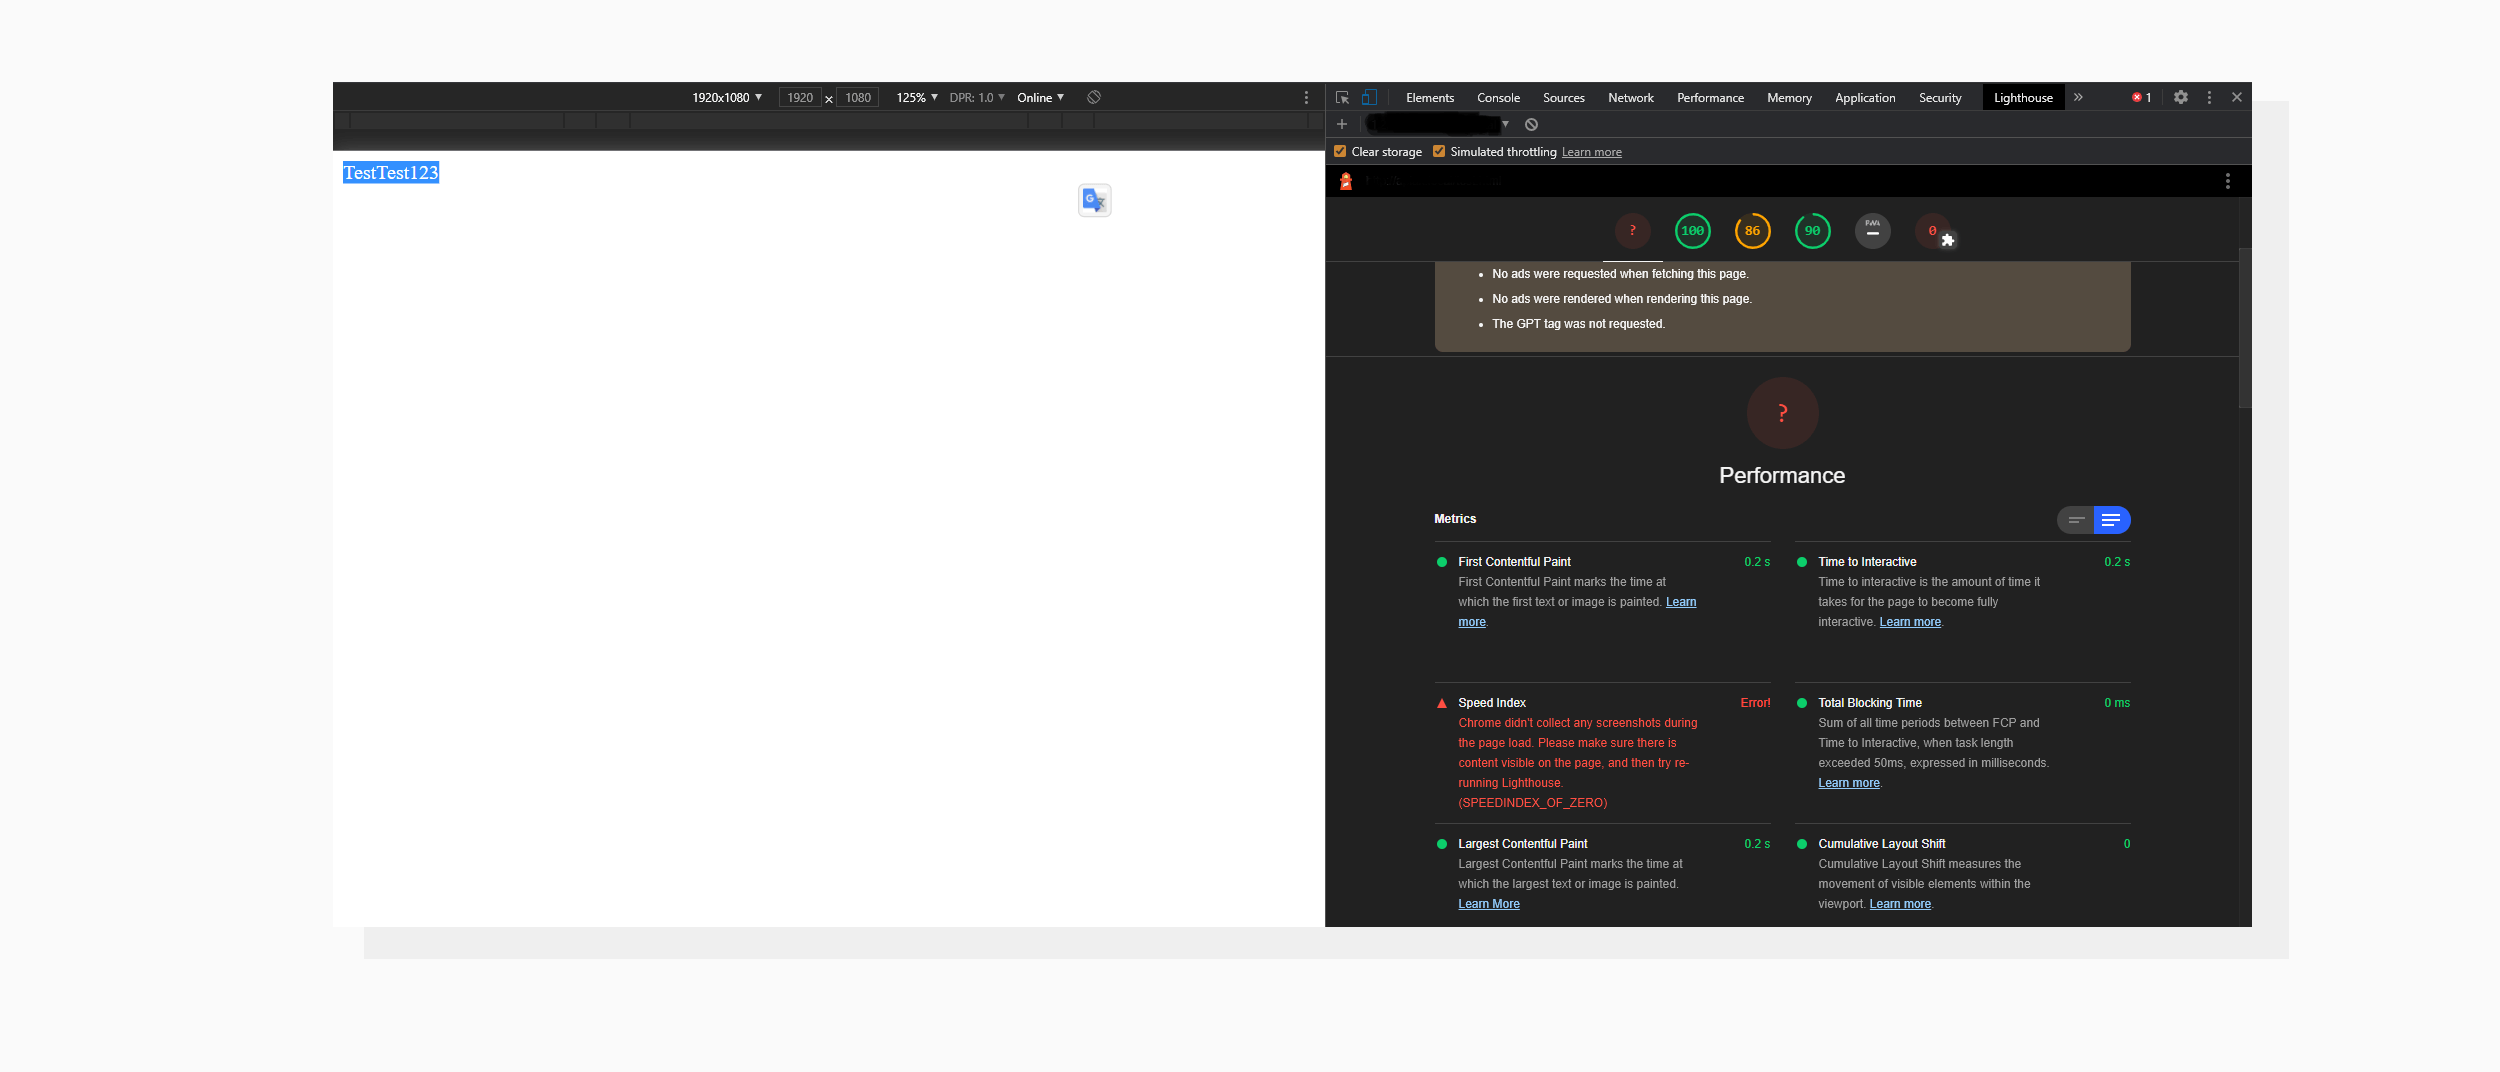
Interesting fact: if you run an audit on an empty, non-changing white page, the metric won’t be calculated.
Speed Index fails to be calculated on an empty page; however, there is a white text (highlighted by mouse) on a white background.
With this metric, Lighthouse also compares your page speed to other websites. Here are the conditions:
Speed Index under 4.3 seconds — green, fast
Speed Index from 4.4 to 5.8 seconds — orange, moderate
Speed Index over 5.8 seconds — red, slow
Largest Contentful Paint
LCP plays a major role in the performance score calculator. It reports the render time of the largest image or text block within the viewport (i.e., the visible part of the page).
Elements that are considered as candidates to trigger the metric:
<img> elements
<image> elements inside <svg> elements
<video> elements (in this case, the poster image is used)
Elements with background image loaded via url() from CSS
Block-level elements with children (text nodes count too) — margins, paddings, and borders are ignored
The largest element can change as the page progressively loads. The last record of the largest element capture gets reported.
A demonstration of how the largest element can change as the page loads. Source: web.dev
Scoring:
LCP under 2.5 seconds — green, fast
Speed Index from 2.5 to 4 seconds — orange, moderate
Speed Index over 4 seconds — red, slow
Time To Interactive
Abbreviated TTI, it measures how long it takes a page to become fully interactive.
Here's what “fully” means in this case:
Useful content (measured by FCP) is displayed
Javascript event handlers are bound to visible elements’ events
The page responds to user interaction within 50 milliseconds
Again, comparison data is taken from HTTP Archive:
TTI under 3.9 seconds — green, fast.
TTI from 3.9 to 7.3 seconds — orange, moderate
TTI over 7.3 seconds — red, slow
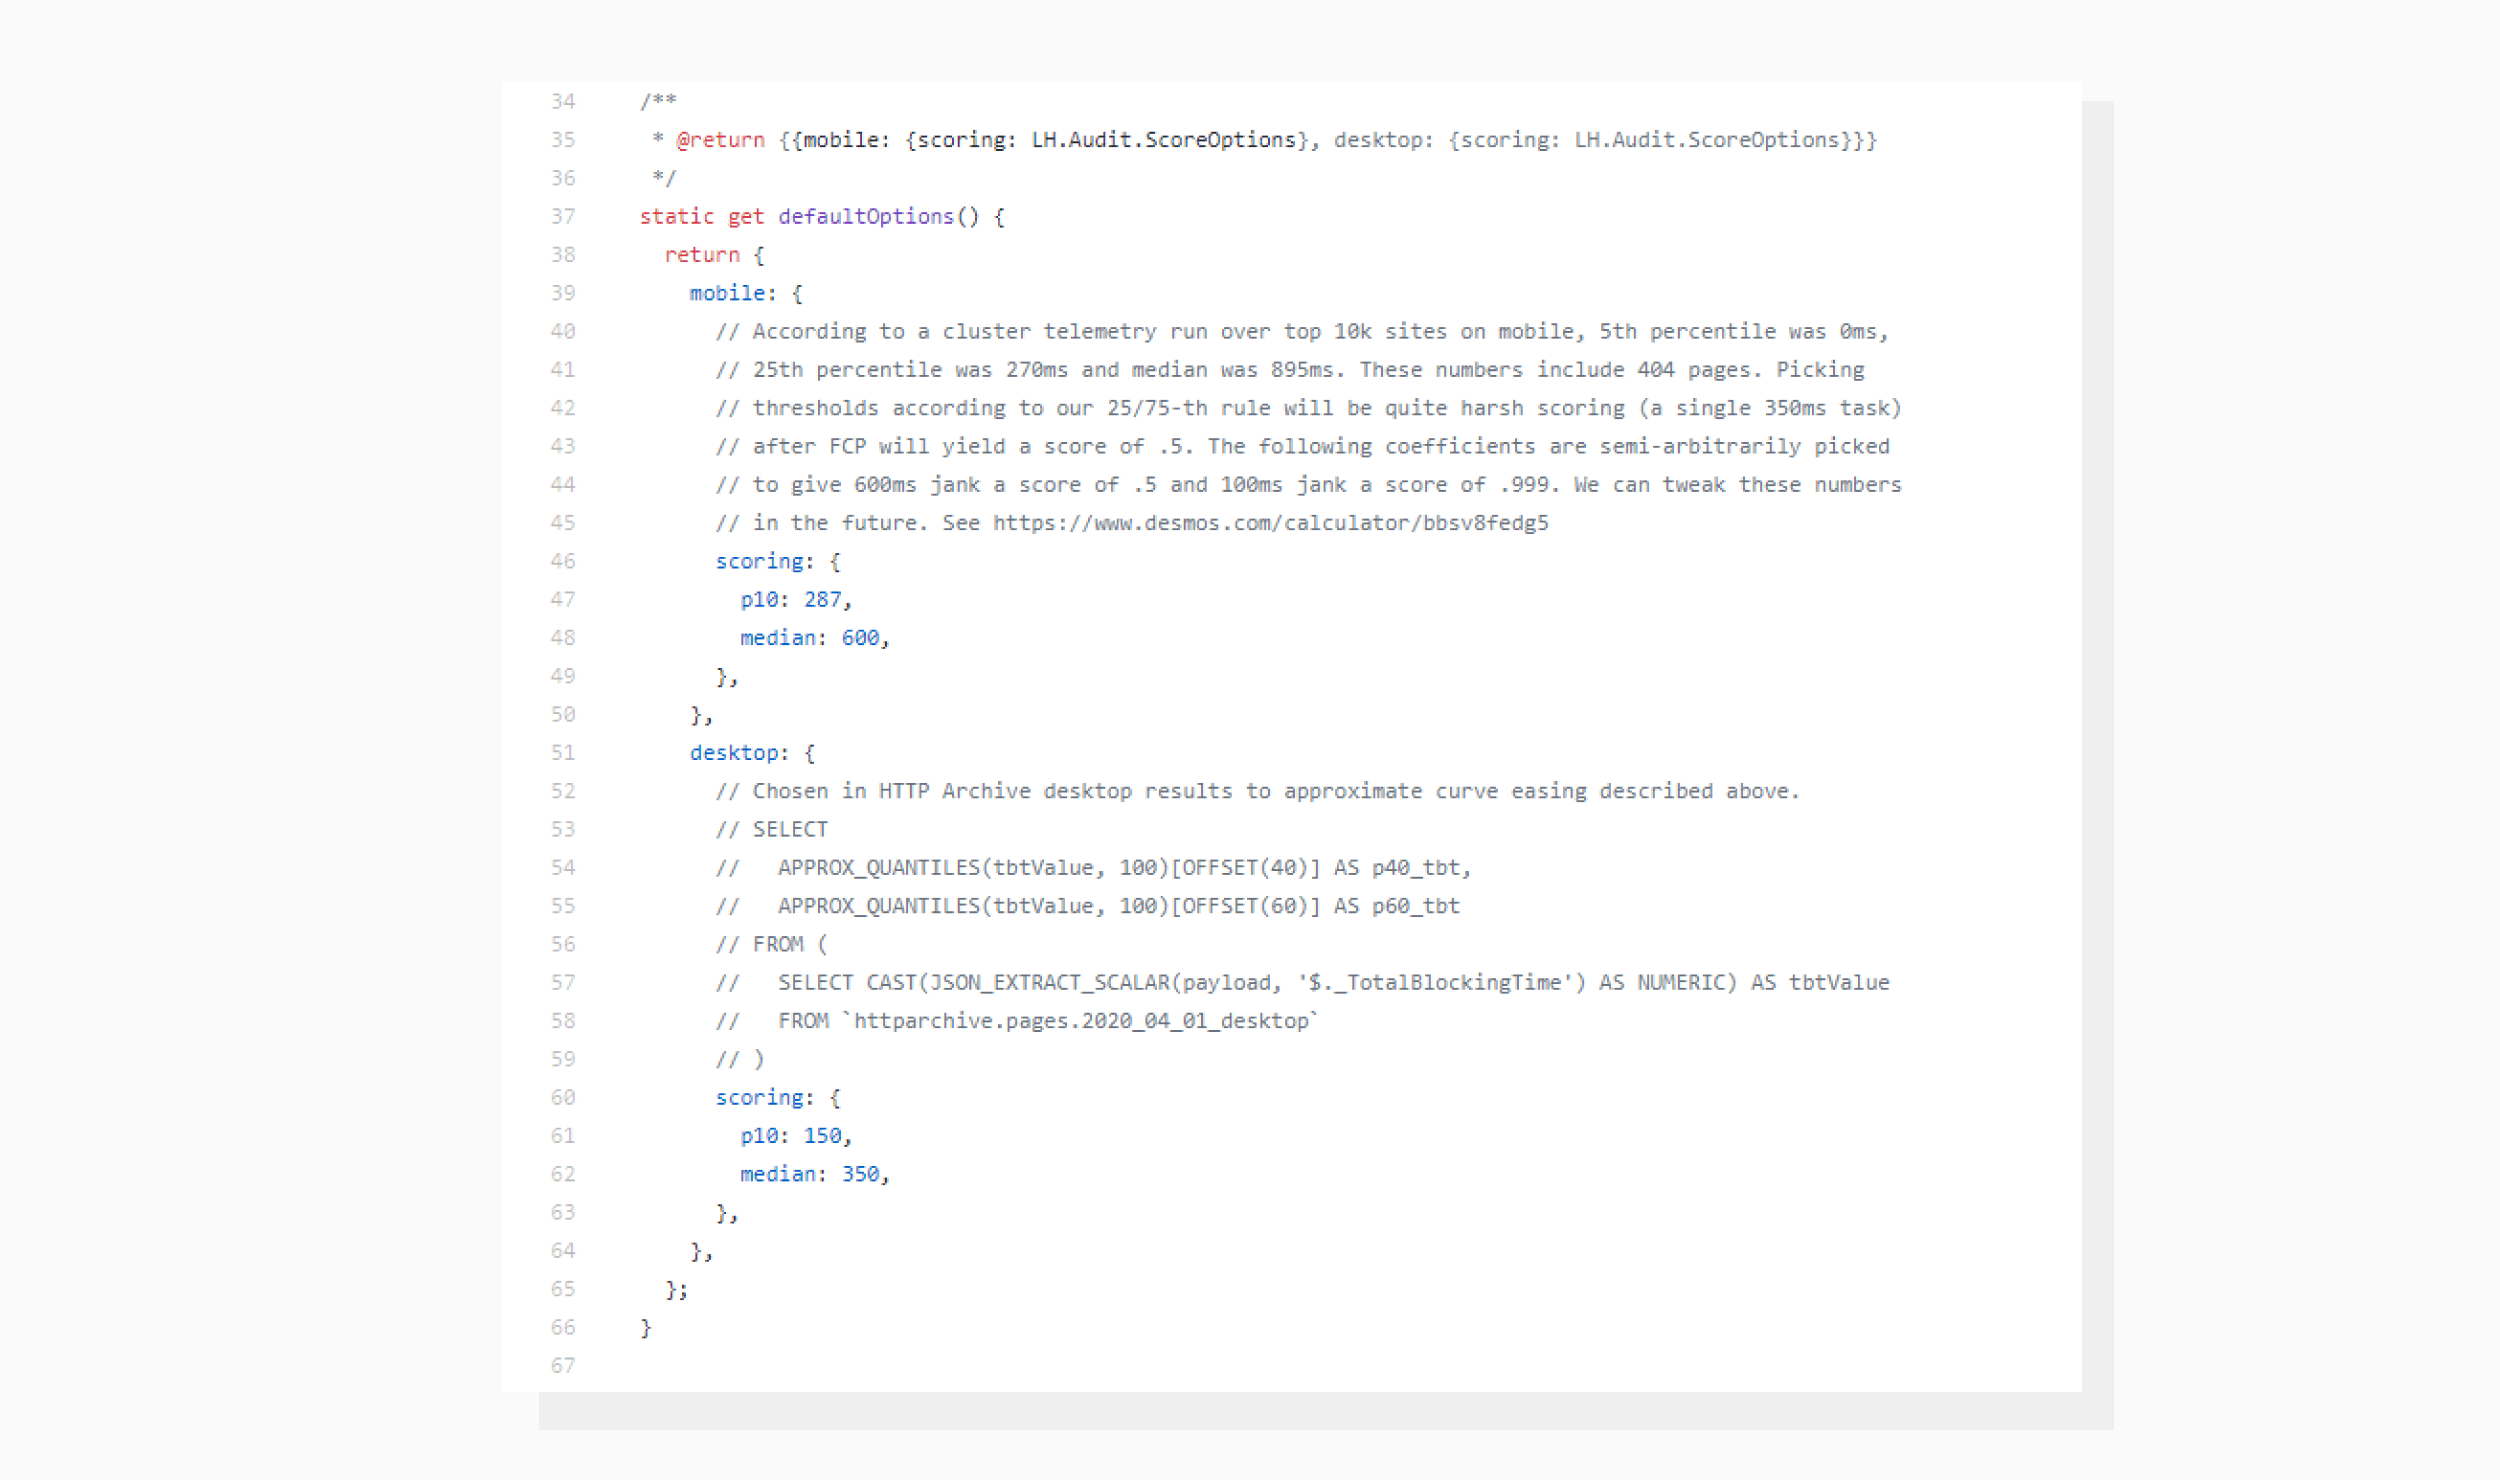
Total Blocking Time
This is the sum of all time records between FCP and TTI when a page is blocked from user interaction for more than 50 milliseconds. For example, if some Javascript code interrupts page loading for 70 milliseconds, then the TBT is increased by 20 milliseconds.
According to Lighthouse’s source code, the TBT score is calculated in comparison with the top 10,000 websites.
TBT from 300 to 600 milliseconds — orange, moderate
TBT over 600 milliseconds — red, slow
Cumulative Layout Shift
CLS can tell you how aggressively elements shift each other. For example, say you’re reading a long text, then an element gets rendered above the part you’re reading and the text gets shifted down. Eliminating situations like this will positively affect the CLS score.
This metric takes into account only unexpected layout shifts. An unexpected layout shift is a layout shift that has had no user input within a 500ms time frame prior to the shift.
How to run an audit
When it comes to running an audit, there are several methods to choose from.
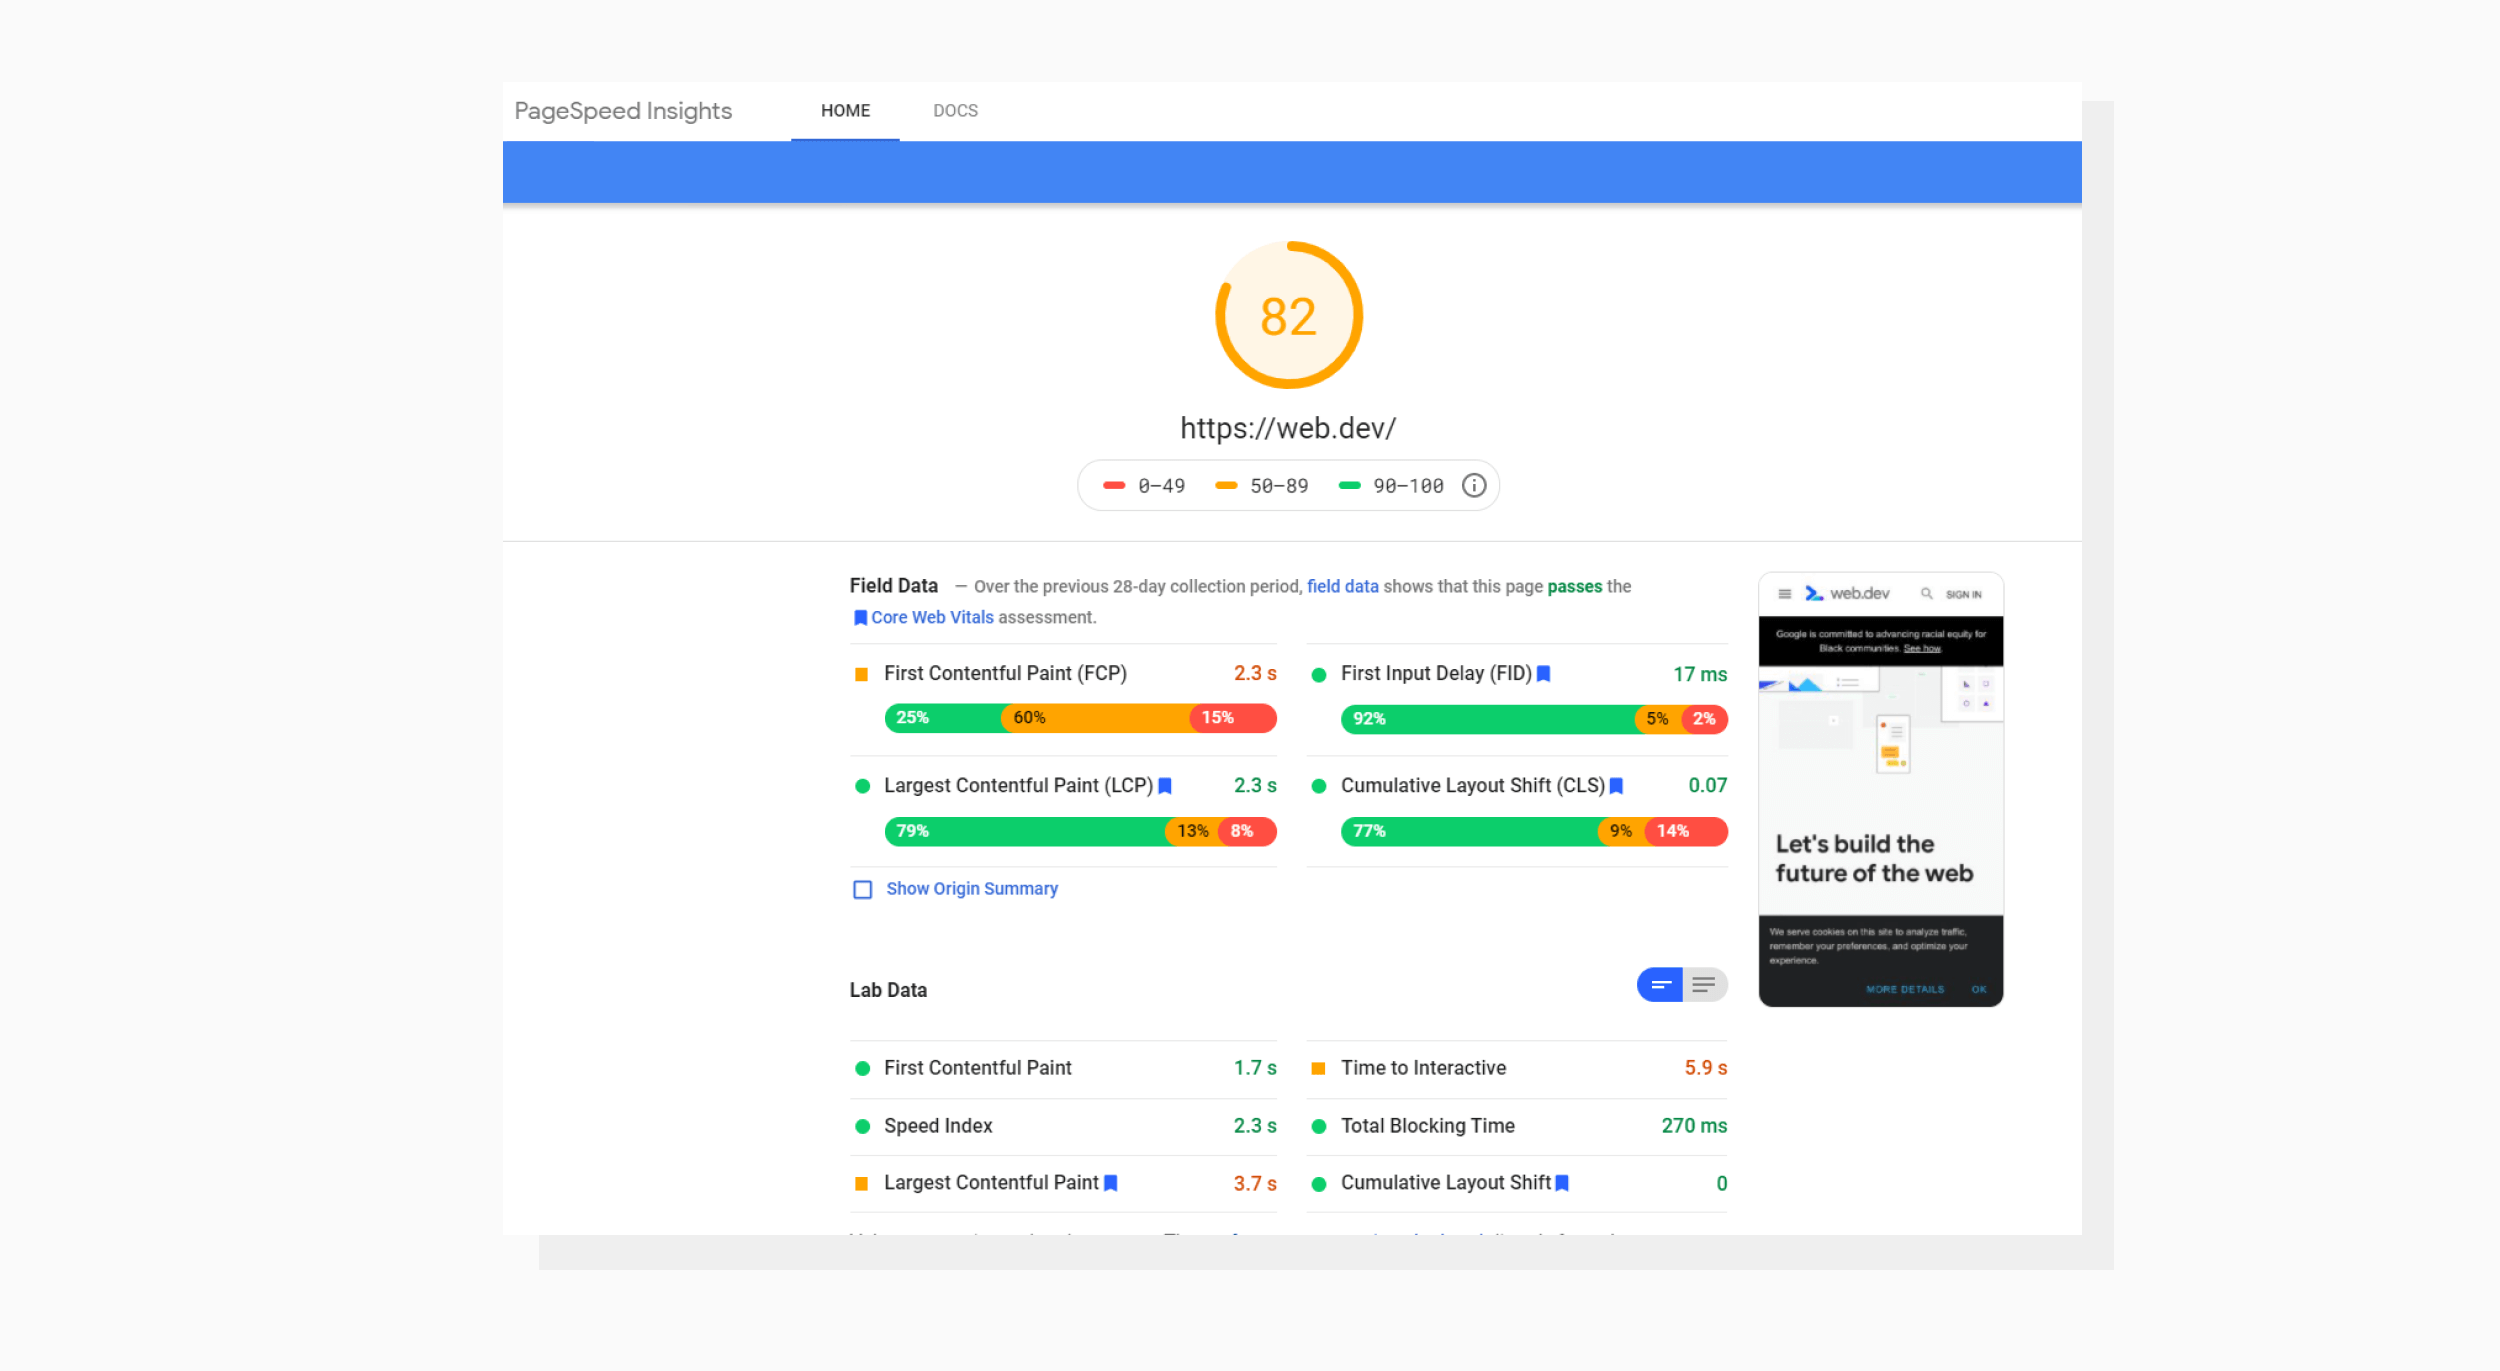
As you may recall, I promised to get back to this tool in the beginning of this article.
While Lighthouse itself gives you additional data and audits, Google PageSpeed Insights is still driven by Lighthouse in the backend but returns Performance data only.
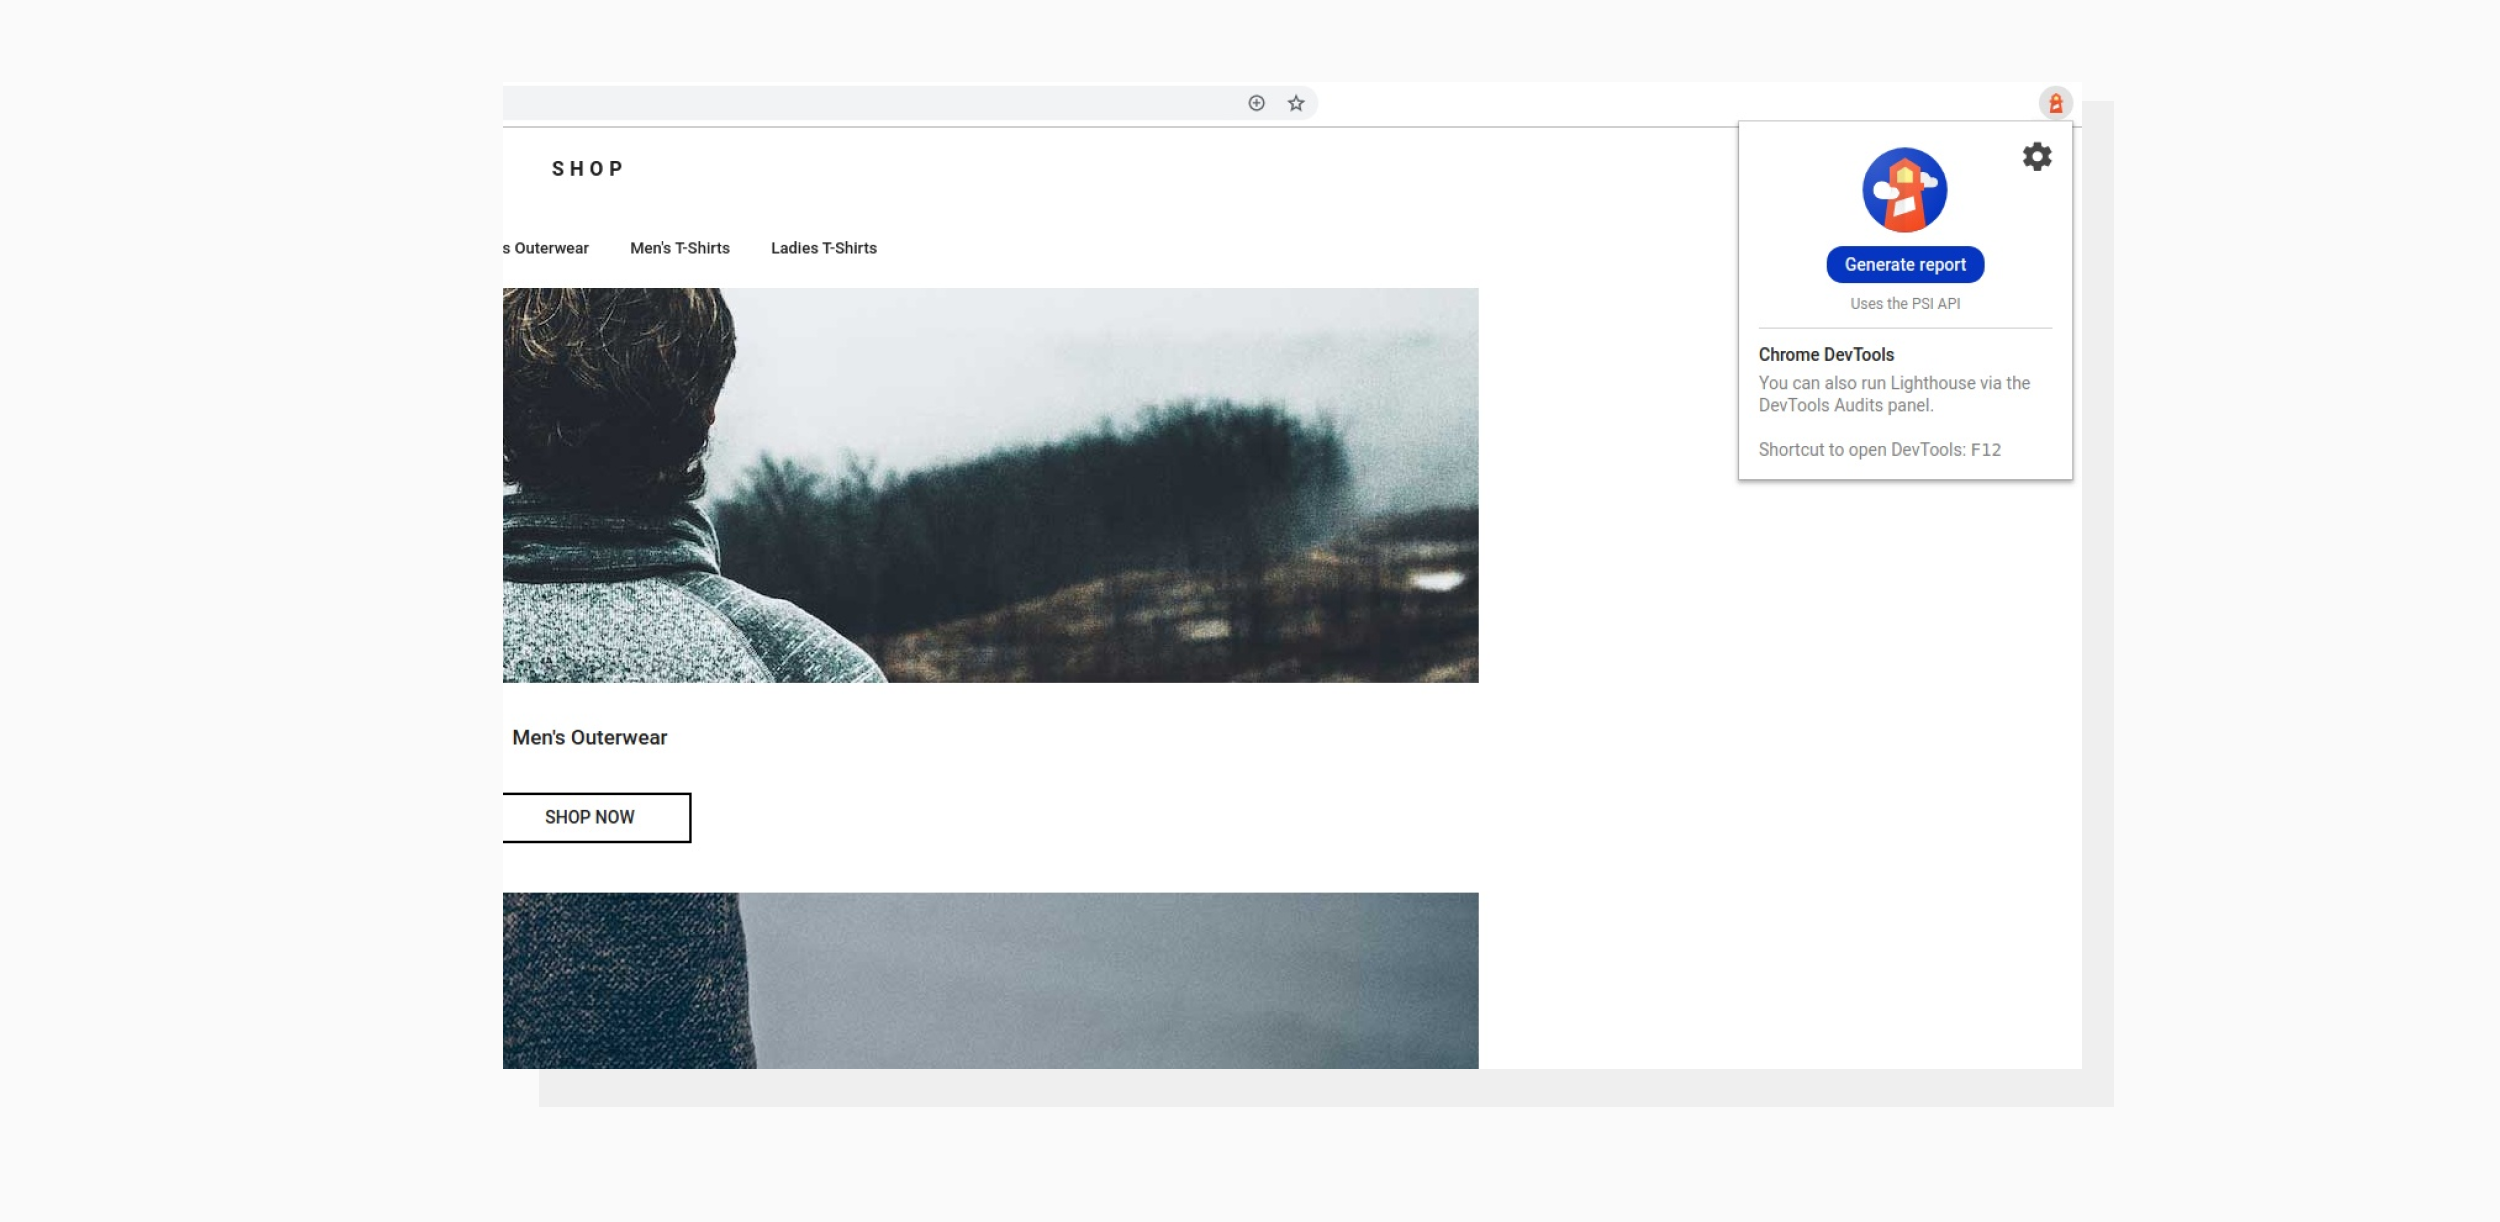
Same functionality but in the form of a browser plugin.
Please note: if you want to test local websites, you should use the methods below. Online methods (including browser extensions) provide results for published websites only.
From Chrome Developer Tools (on Chromium-based browsers)
This is how I made screenshots for the metrics in this article.:
Go to the page you want to audit.
Open DevTools (Ctrl+Shift+I or F12 on Windows, Cmd+Option+I on Mac).
Go to the Audits tab.
Click Perform an audit and select the desired categories.
Run the audit.
This can be especially useful when testing pages that require user authentication.
What’s interesting here is that Lighthouse is available not only in Google Chrome, but in some Chromium-based browsers as well. For example, below is a screenshot of a Lighthouse audit taken from the latest version of Microsoft Edge, which now uses the same engine as Google Chrome:
A screenshot of a Google Lighthouse audit launched from Microsoft Edge browser.
Run Lighthouse as a Node module
This will allow you to run an audit from a command line and get an *.html file with the audit results.
Make sure you have Google Chrome installed on your machine.
Install the current Long-Term Support version of Node (the following example was done with the latest non-LTS version, but Google itself recommends using the LTS version).
Install Lighthouse globally with the following command: npm install -g lighthouse
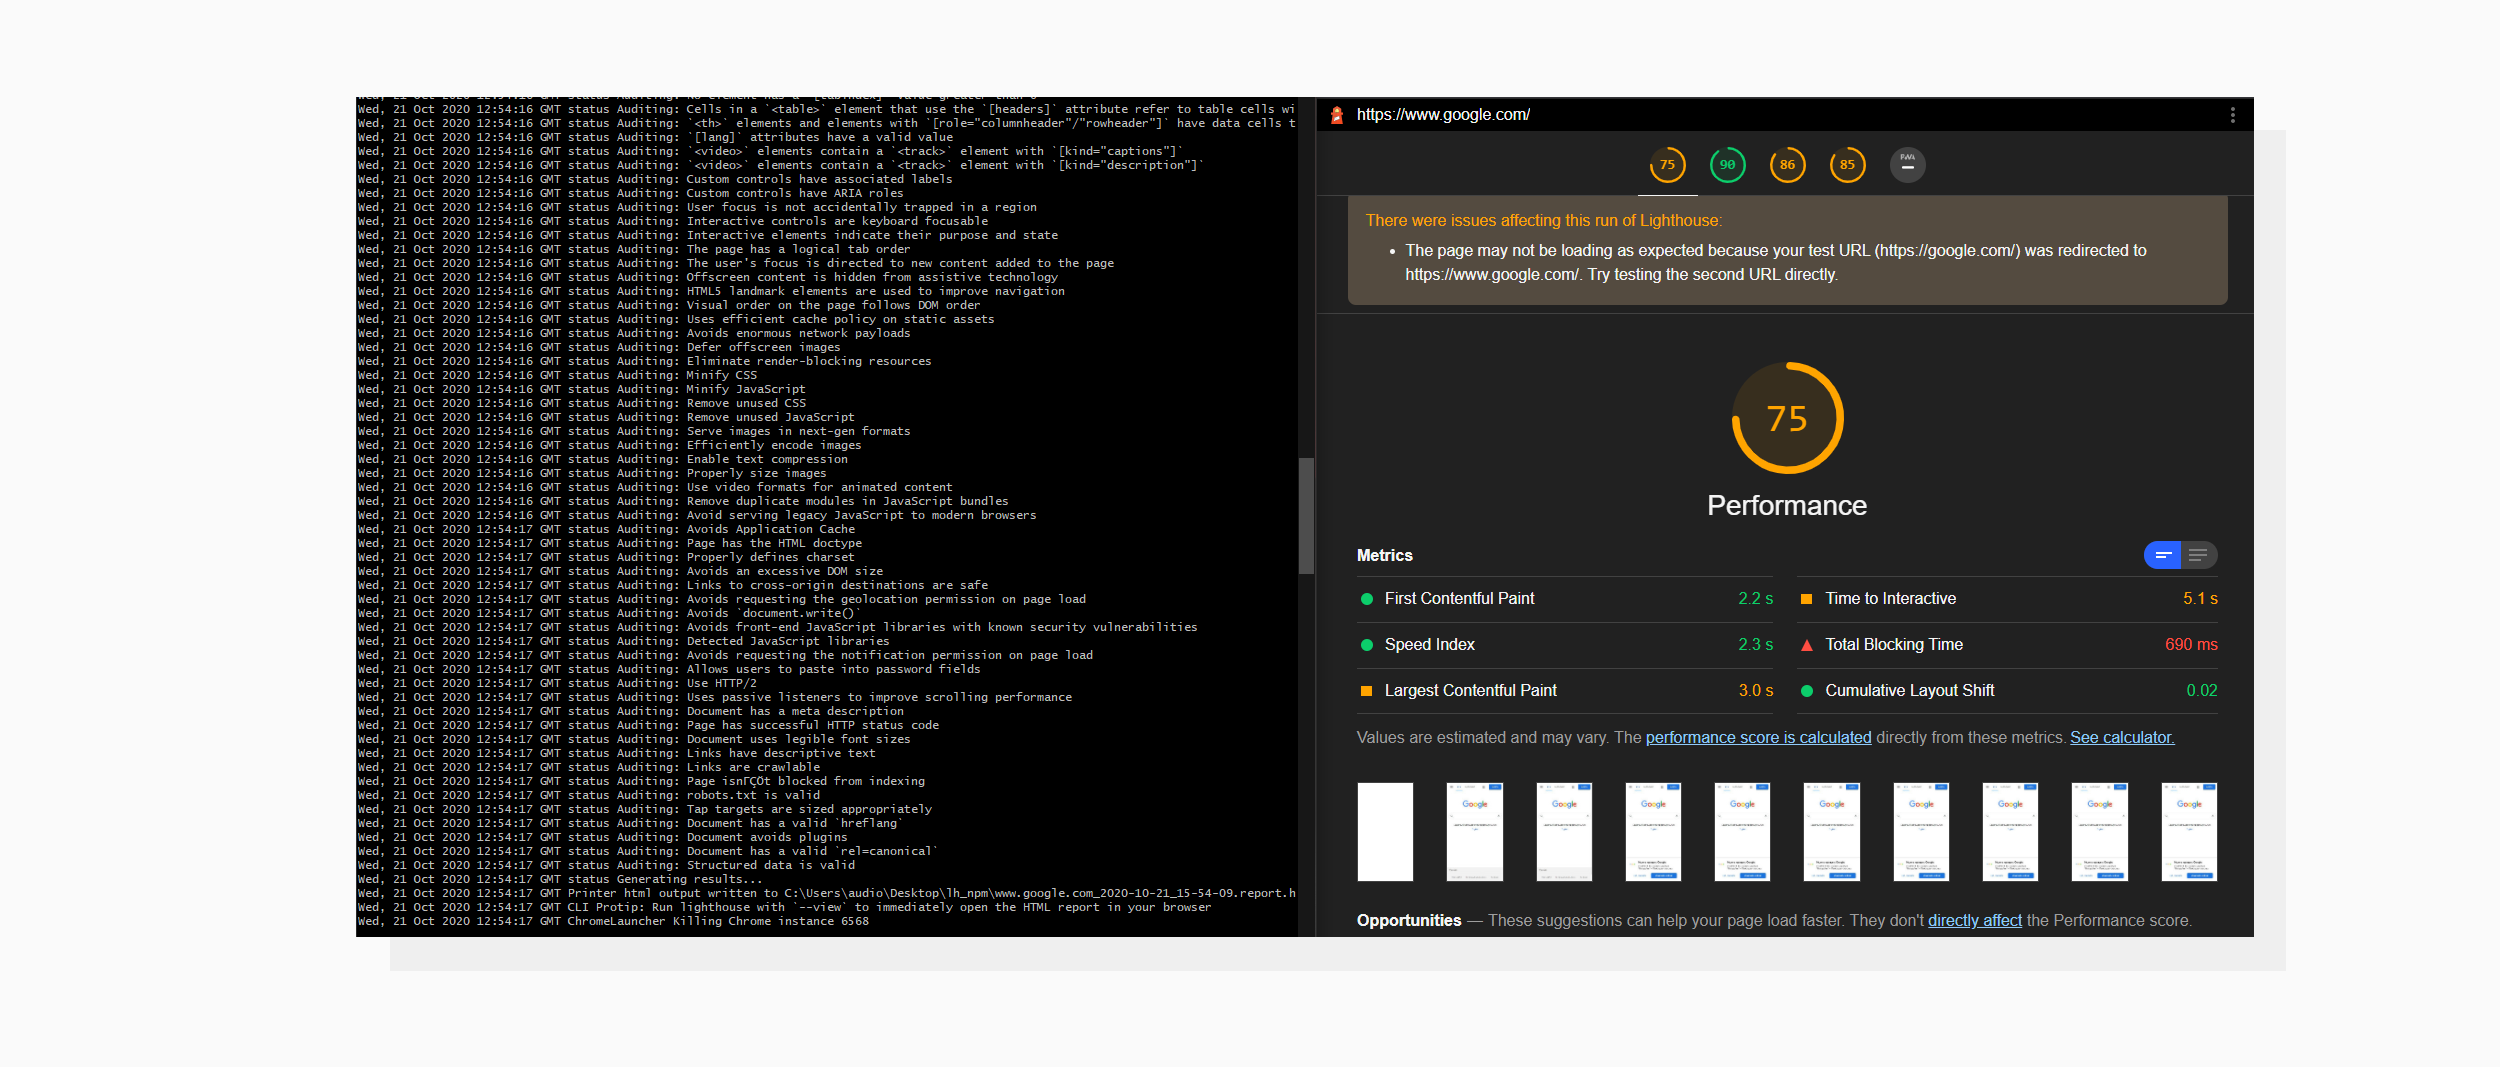
Let’s run a demo audit with the lighthouse “https://google.com” command.
A Chrome window will appear automatically for audit purposes. The generated report will be stored in the current folder.
When running an audit, Lighthouse will print the current stages of testing (on the left) and when done, generate an HTML file with the report data (on the right).
Run Lighthouse module programmatically
If you’re running integration processes, you can use Lighthouse as a module to run automated tests. Here’s an example:
const fs =require('fs');const lighthouse =require('lighthouse');const chromeLauncher =require('chrome-launcher');(async()=>{const chrome =await chromeLauncher.launch({chromeFlags:['--headless']});const options ={logLevel:'info',output:'html',onlyCategories:['performance'],port: chrome.port};const runnerResult =awaitlighthouse('https://example.com', options);// `.report` is the HTML report as a stringconst reportHtml = runnerResult.report;
fs.writeFileSync('lhreport.html', reportHtml);// `.lhr` is the Lighthouse Result as a JS object
console.log('Report is done for', runnerResult.lhr.finalUrl);
console.log('Performance score was', runnerResult.lhr.categories.performance.score *100);await chrome.kill();})();
I want to stress that performance plays an important role when it comes to website speed. Nowadays, since pages usually contain lots of visual data, optimizing images has become very important as well. If you’re interested in a comprehensive report on how the images on your website perform, try PageDetox by Uploadcare.
This tool gives you a CX score (customer experience score) that demonstrates how well your images are optimized to be viewed by customers. Not only that, PageDetox also provides insights on what to improve (even down to particular images on the page) and how much (in percentage) you could benefit from using image loading tools like Adaptive Delivery.
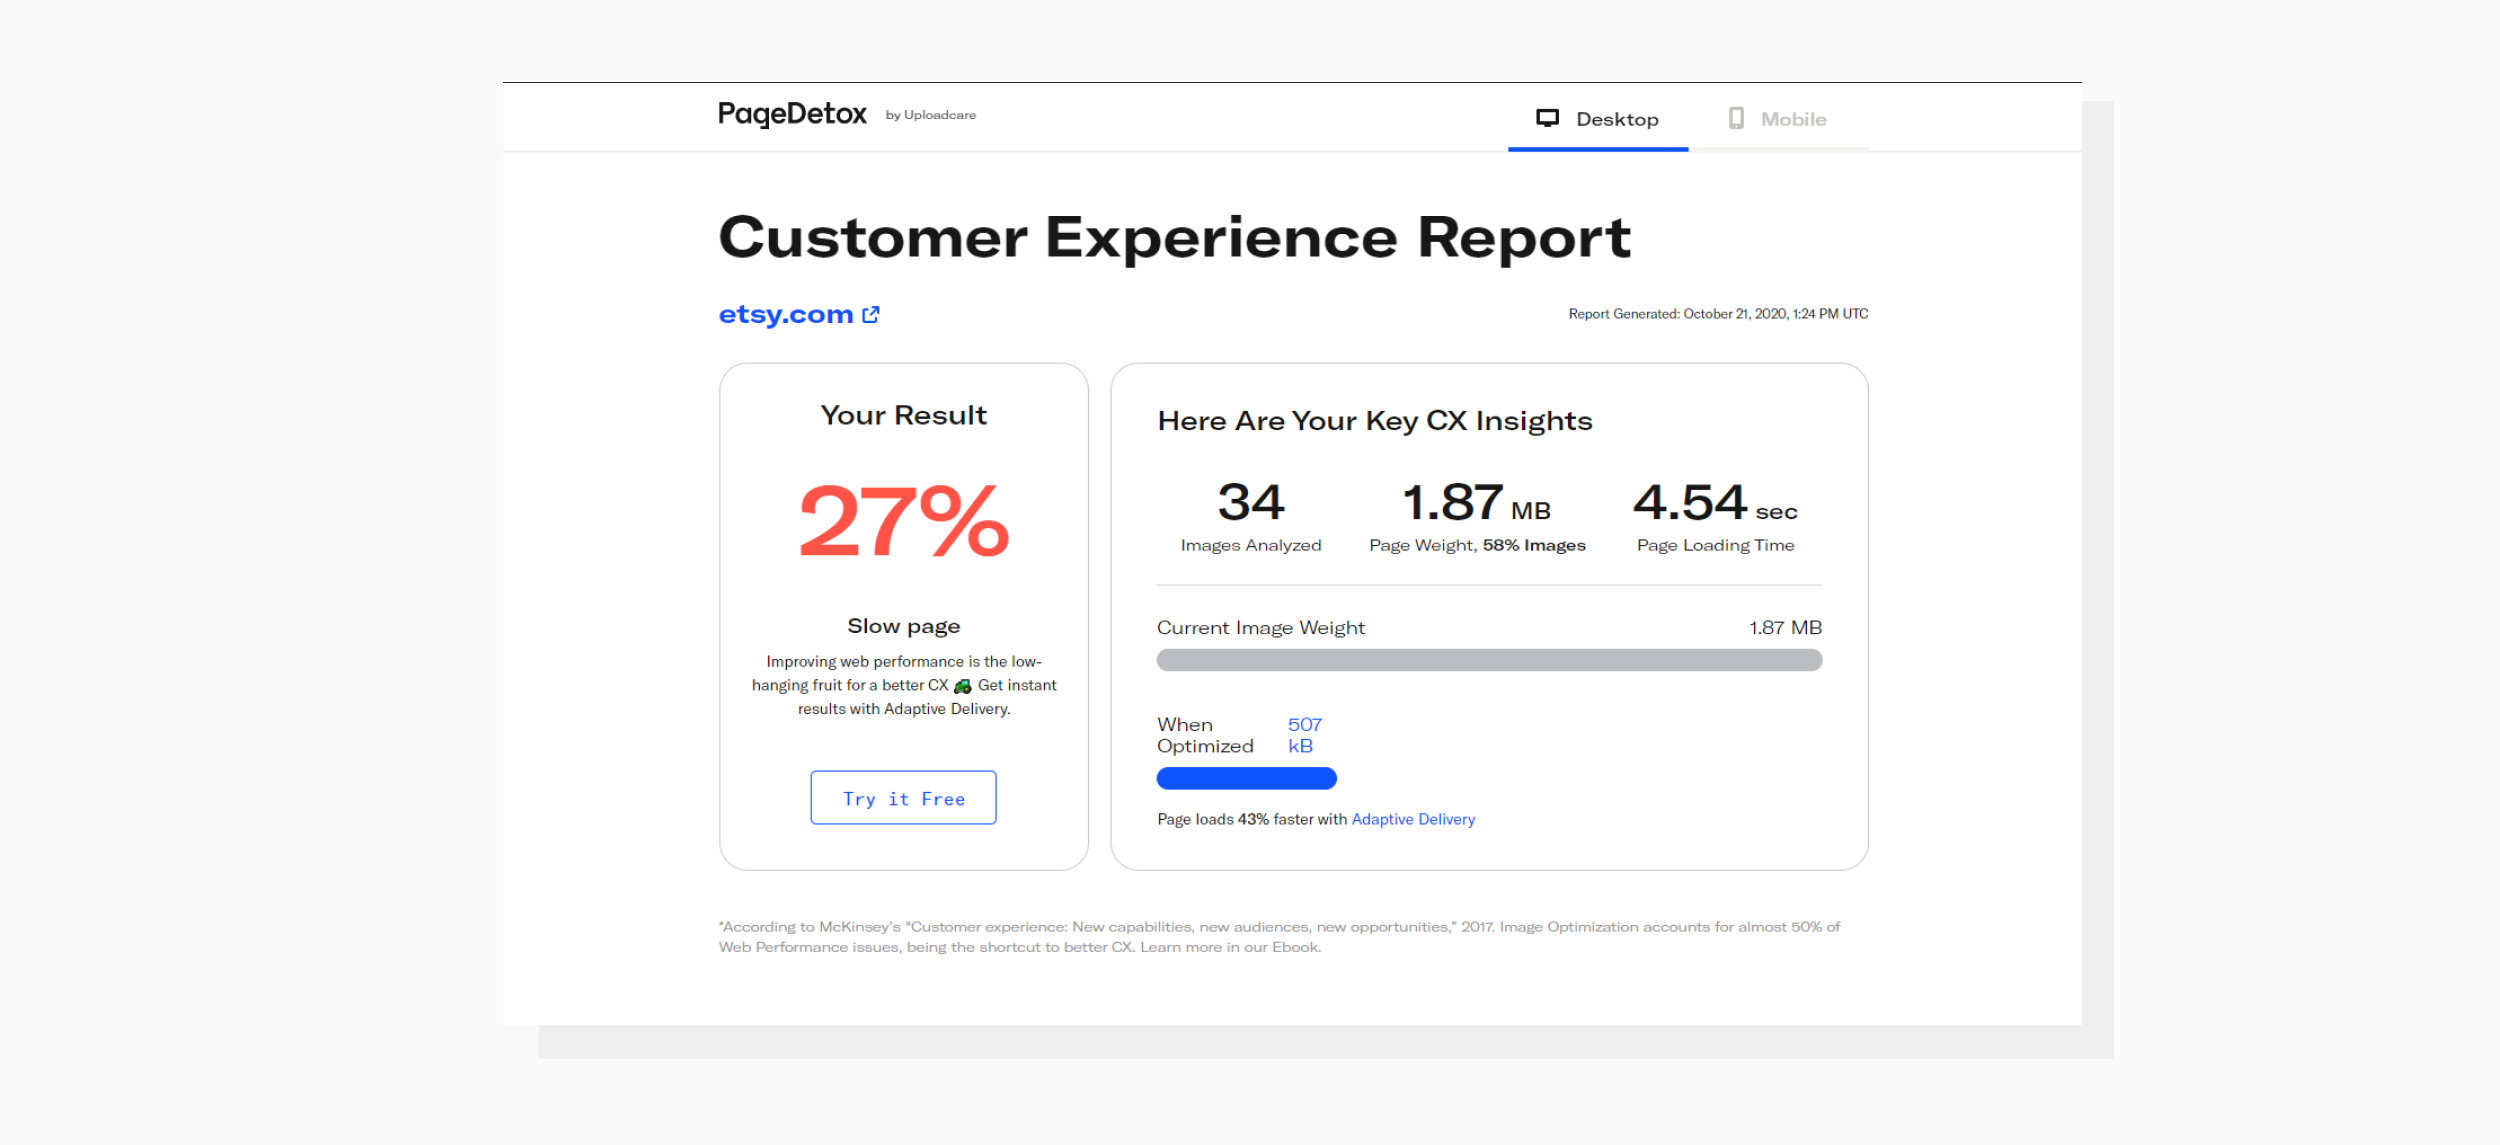
As an example, let’s take a look at an audit run on Etsy.com:
Summary data of etsy.com audit.
Now that you know the metrics, it's time to put them into action and let the world see the full potential of your website!
Web Developer Who Cares with 10+ years of experience and a Computer Science degree. Top Rated Plus talent on Upwork. Also likes making music, parkour, tech and cappuccinos.