We analyzed the world’s top 500 websites (source: Alexa.com) to find out how you can take over your competitors.
Google cares about website performance more than ever before. Performance is a ranking factor for search and ad results (Google, Jan 14, 2019). Site performance has a direct effect on your business metrics (Test My Site by Google). Google measures performance through the dedicated Performance Score.
Performance Score is determined by Lighthouse simulating a page load and analyzing the derived lab data. 100 is the best possible score which represents the 98th percentile, a top-performing site. A score of 50 represents the 75th percentile.
A score of 90–100 is considered fast, and 50 to 90 is considered average. Below 50 is considered to be slow.
A high-performance site:
- Improves site position in search engine results (source: Google).
- Decreases the number of bounced visitors (source: Pingdom).
- Increases the number of site pages viewed during every session (source: Section).
However, it’s usually unclear how improving performance affects those metrics exactly. Generally, this leaves people guessing whether or not implementing optimizations is worth it.
Many articles on web performance out there mention “image optimization” as a primary step in accelerating websites. Now, what’s the exact impact?
Let’s guess less and measure more
Images are one of the things we focus on as a company here at Uploadcare. Each month we receive tens of millions of images and deliver hundreds of terabytes of their processed versions. We decided to perform large-scale research on image performance to see how significant the impact can be on Google’s Performance Score.
As a first step, we took the world’s top 500 websites (like USA Today, IKEA, and Behance) and ran performance analyses with Lighthouse (performance analyzer made by Google) and PageDetox (a diagnostic framework made by us).
We want to share the numbers so you could better understand where you stand.
Is the hype about optimizing web performance worth it?
Why should you care? The answer is simple — competition.
You can optimize your website in many ways. Take search engine optimization; when optimized with the right keywords, content lengths, and backed with authoritative domains, your website gets ranked higher in search results.
However, while the average Lighthouse SEO score is 93 for the analyzed pack, the performance score is only 48.
What does this mean for you? You can choose where you compete for optimization. Simply put, getting above average in SEO means achieving 93+ points while there’s roughly twice as much opportunity in optimizing for performance. Also, it takes time to prove your SEO strategies while you can quickly achieve the target performance metrics.
If your niche is competitive, and a search engine is ranking two websites with similar content and SEO score, it will prioritize the one with a higher Performance Score.
That’s also logical from the user experience perspective. The faster your site is, the smoother the user experience; thus, your analytics platform registers fewer bounces, more page views, and higher conversions.
In our research, we focused on the total image weight of analyzed pages. On average, images take up to 53% of your entire page weight (according to Pingdom). This means they have a big impact on page-loading times and, subsequently, overall performance.
A bit of theory
This section unveils how exactly image performance affects Performance Score. It’s a bit technical, so if you want the top 500 websites' actual figures upfront, skip down to the next section.
Lighthouse uses the following metrics to calculate Performance Score based on their weights:
- First Contentful Paint (FCP, users perceive a page as responding), weight 3
- First Meaningful Paint (FMP, page’s primary content appears on the screen), weight 1
- Speed Index (SI, visible page content gets displayed), weight 4
- First CPU Idle (page becomes minimally interactive), weight 2
- Time to Interactive (TTI, page becomes fully interactive), weight 5
While none of the above reads as “image content weight and loading time,” you can find performance improvement opportunities specific to images in a Lighthouse report. They are:
- Defer offscreen images, implement lazy-loading.
- Properly size images, implement Responsive Images.
- Efficiently encode images, balance out quality levels.
- Serve images in next-gen formats, use WebP where possible.
- Use video formats for animated content, convert GIFs to video formats.
Note, these can be seen in your complete Lighthouse report JSON under the “load-opportunities” key, with zero weights. This means these image issues do not directly affect your performance score calculations. However, they do leverage all five components of the Performance Score.
So, the idea is that by optimizing images and their delivery, we can improve all five Performance Score components. Now, let’s proceed to our findings.
Here’s what we found out
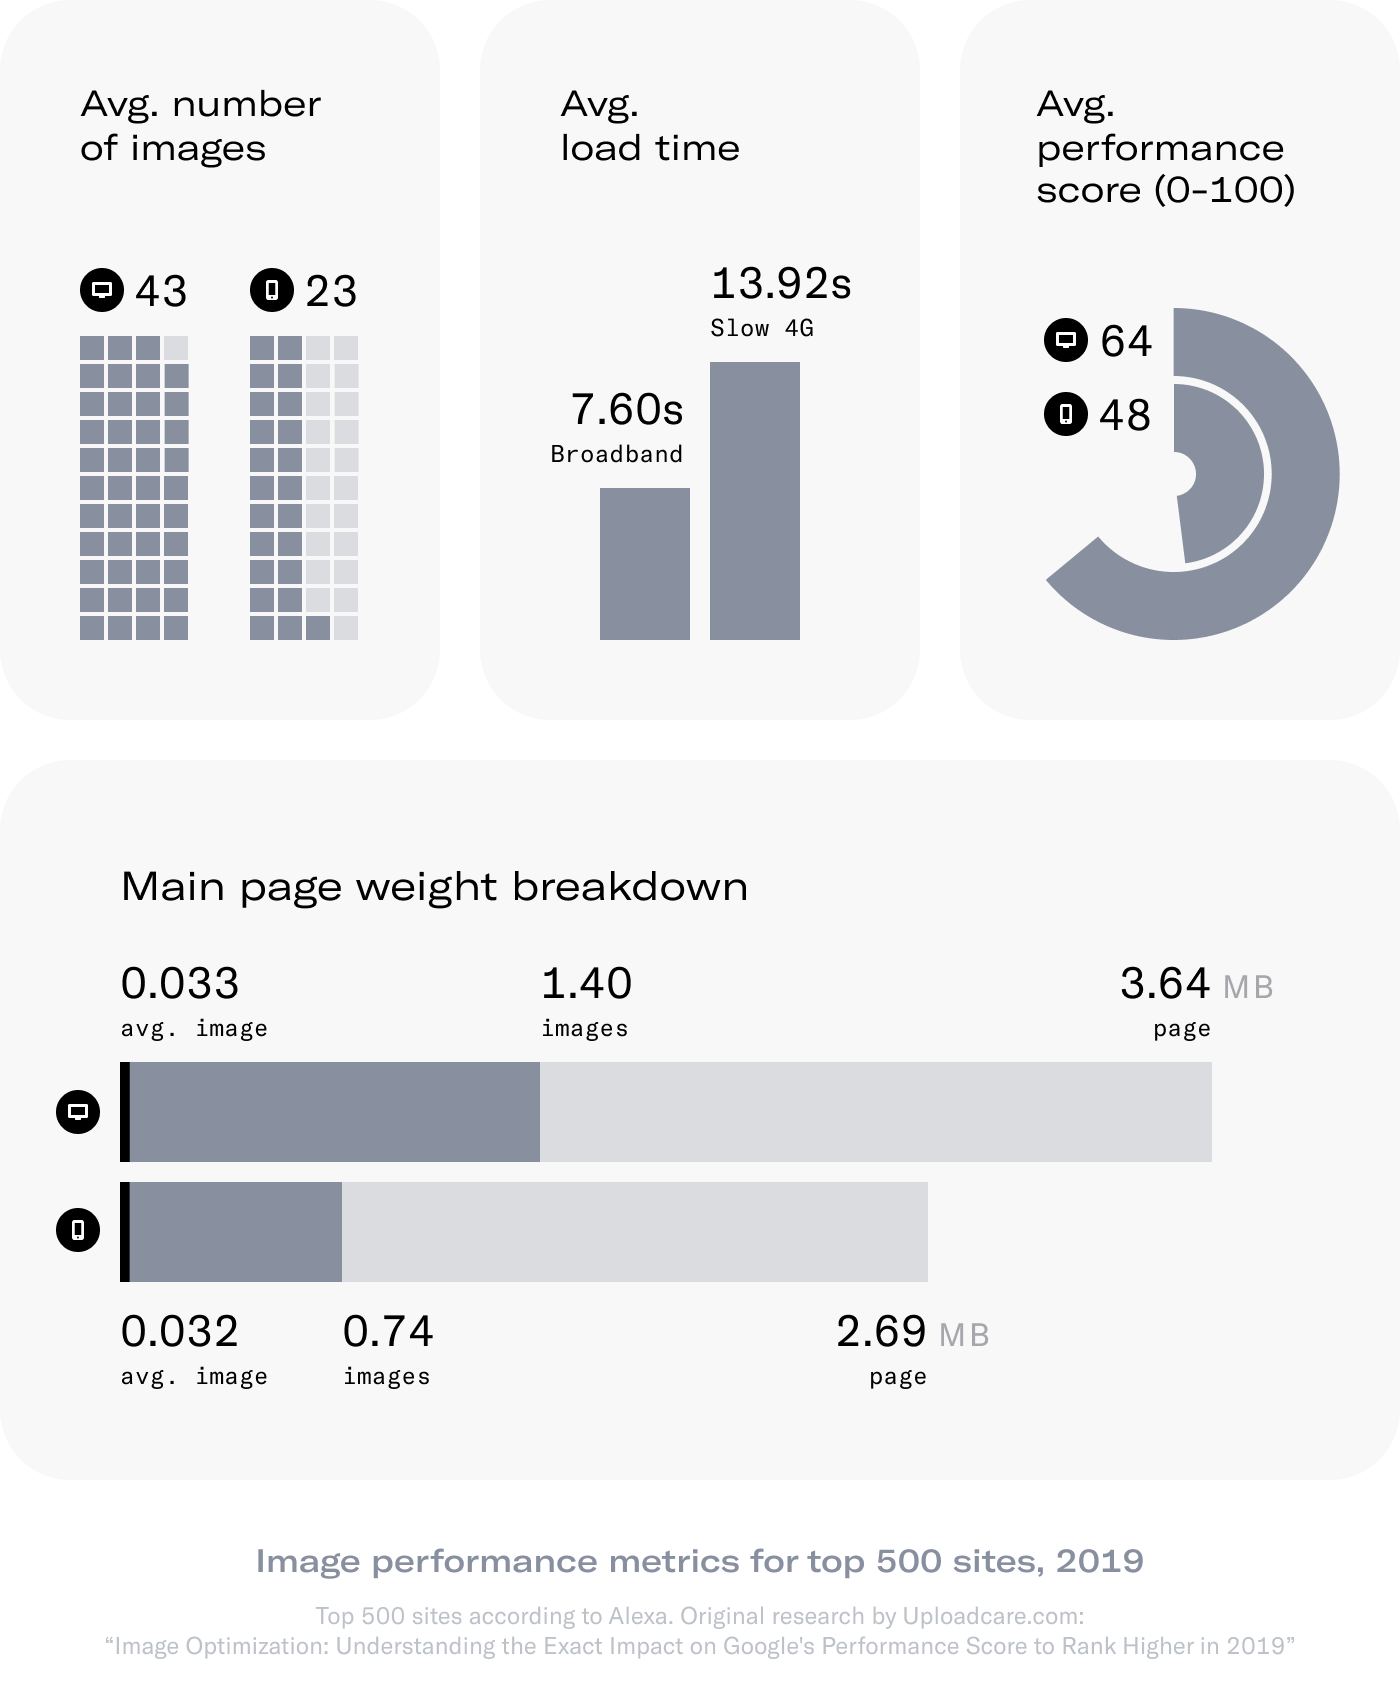
After analyzing the main pages for over 500 of the leading websites out there, we ended up with the following averages:
- Image count: 43 on desktop and 23 on mobile.
- Page weight: 3.64 MB for desktop and 2.69 MB for mobile.
- Image content weight: 1.40 / 0.74 MB, which results in 33 / 32 KB per image.
- Page load time: 7.6 seconds on broadband (10Mb/s) and 13.92 seconds on slow 4G (1.5 Mb/s).
- Lighthouse Performance Score (normalized on a scale from zero to one): 64 on desktop and 48 on mobile.
It’s interesting to note that among the most performant sites on our list were the obvious candidates like google.cn and wikipedia.org along with less obvious ones like wordreference.com and ikea.com. On the “sluggish” end were usatoday.com, kaskus.co.id, and deviantart.com.
Here is the raw data we collected and used to analyze the world’s top500 sites' performance. We highlighted the rows of the websites we couldn’t collect data for: one of the two analyzers failed, etc.
So, where’s the room for improvement?
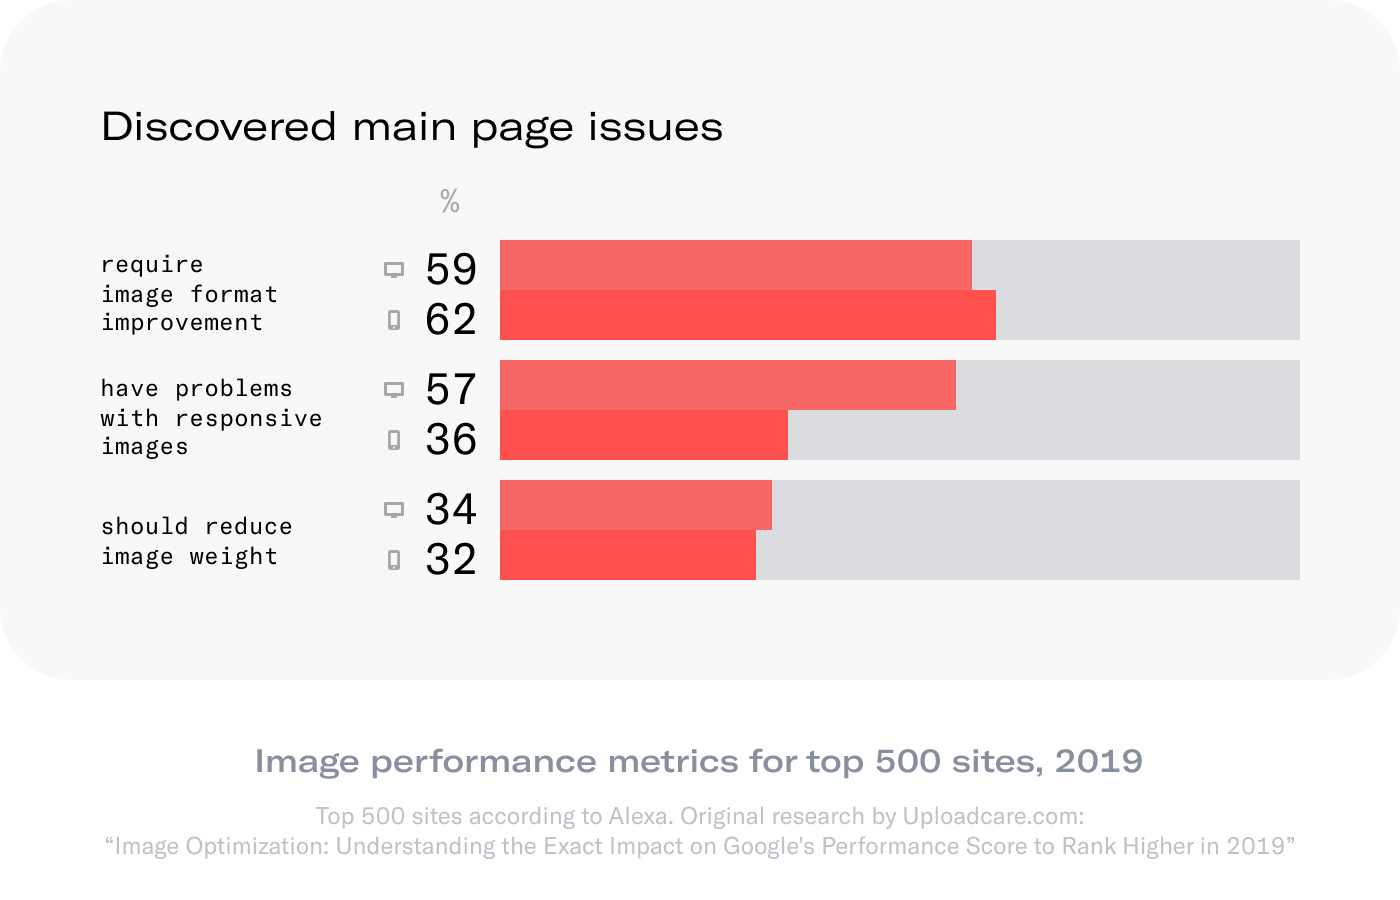
Let’s take a look at the insights derived from Lighthouse reports for desktop / mobile websites:
- 59% / 62% require image format improvements.
- 57% / 36% have problems with responsive images.
- 34% / 32% have image weight issues.
What can be achieved
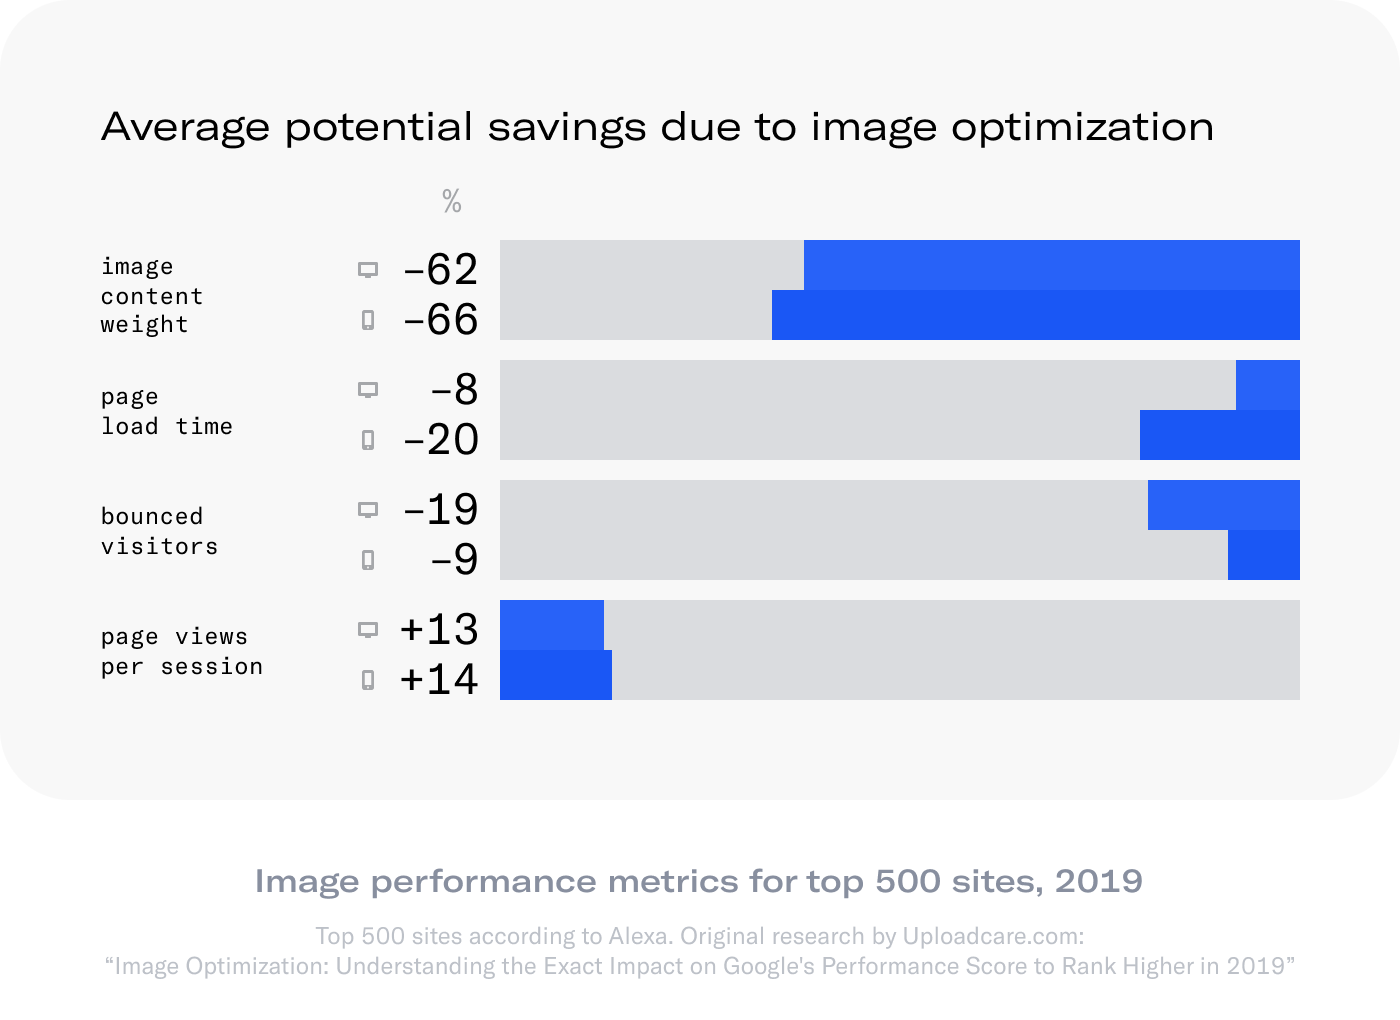
If we fix all the three types of issues, on average, we’ll:
- Reduce image content weight by 62% on desktop and by 66% on mobile.
- Reduce page loading time by 8% / 20% respectively.
- Decrease the amount of bounced visitors by 19% / 9%.
- Increase the number of website pages viewed by a user during a single session by 13% / 14%.
What about the actual performance score?
We can predict the impact.
Since Google provides its performance score calculator, the only thing left is understanding the new FCP, FMP, SI, CPU, and TTE.
Thanks to Lighthouse, we know the parameter values for the analyzed set of sites. All five components of the performance score are expressed in seconds.
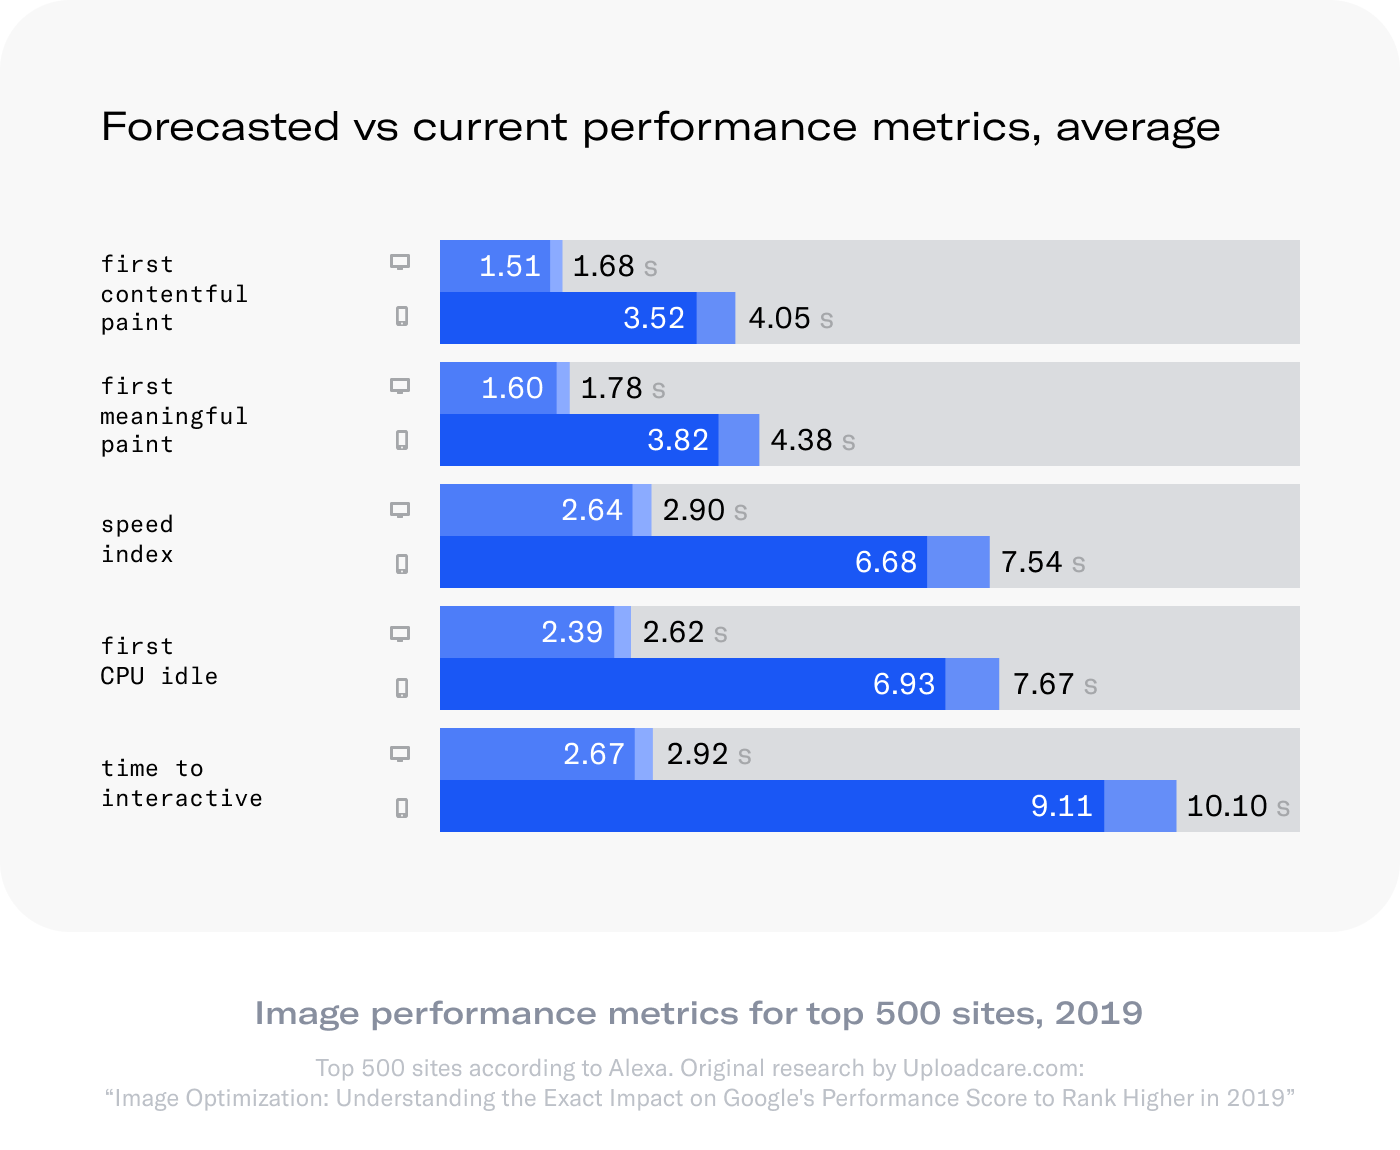
Current state:
- First Contentful Paint — 1.68 / 4.05
- First Meaningful Paint — 1.78 / 4.38
- Speed Index — 2.90 / 7.54
- First CPU Idle — 2.62 / 7.67
- Time to Interactive — 2.92 / 10.10
We also know:
- The number of bytes saved by optimizing images
- The initial load time for every desktop and mobile main page version
- The number of seconds we can shed from the load time
- The percentage of load time improvement
We assumed that if we proportionally decrease these metrics, we might come up with a reliable approximation.
Forecasted results:
- First Contentful Paint — 1.51 / 3.52
- First Meaningful Paint — 1.60 / 3.82
- Speed Index — 2.64 / 6.68
- First CPU Idle — 2.39 / 6.93
- Time to Interactive — 2.67 / 9.11
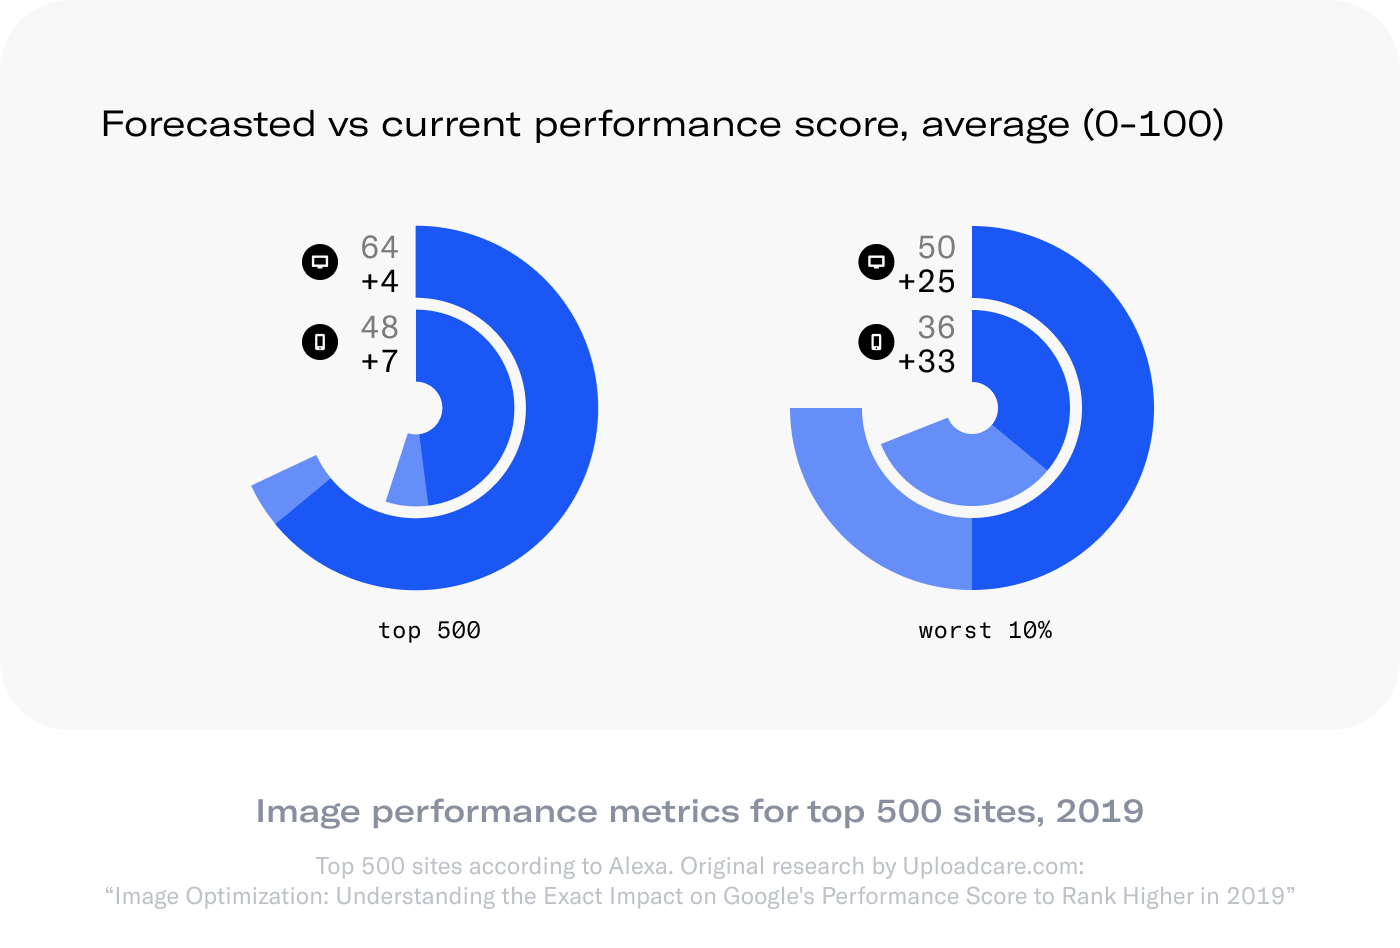
Given that, the average optimized Performance Score for the world’s top 500 websites will improve by 4 points for desktop and 7 for mobile, and up to 25 / 33 for the worst-performing 10%.
We can’t tell how exactly the improved Performance Score will affect SERP positions for the analyzed websites (nobody can, Google included). The fact is that maximizing the score provides increased chances to get higher rankings.
When accelerating the site, we also improve the user experience along the way. We can then expect that decreasing the number of bounced visitors and increasing page views directly affects conversion rates for the top of the analyzed sites’ funnels.
Image optimization is one of the easiest and quickest proven ways to get there. And, where even the world’s top 500 websites have room for improvement, get in the lead.
This is the low-hanging fruit. It may seem complicated, but you can quickly implement the optimizations with the right tools.
You can analyze your website now and then go to our ultimate guide on using Uploadcare to get rid of every issue and improve scores by using webp images, compressed images, and responsive images.
Want a performance report focused on your business niche? Drop us a line in the comments.