Interaction to Next Paint: how to measure and improve it
INP is a new performance metric that represents a page’s overall responsiveness to user interactions after loading it. The metric is a successor to First Input Delay (FID), and it applies the same foundational concepts to the overall page experience, not only to its loading state. In March 2024, Google replaced FID with INP in Core Web Vitals.
This article is intended to explain the concepts behind INP, its impact on Core Web Vitals (as of October 2024), and ways to improve it following an example scenario.
Prerequisites
- Understanding of basic web development
- Access to edit app configuration parameters/code
What exactly does INP measure
INP measures the time between an interaction and the next painted frame. Many user interactions can occur within one page-viewing session, and the metric is designed to observe all the interactions made on a page and display the longest while ignoring outlying values.
What is an interaction
When talking about INP, an interaction is one of the following:
- Mouse click
- Tapping an element (on touch-supported devices)
- Pressing a key on a keyboard, both digital and physical
Why is this important?
Put into the UX terms, the metric assesses a website’s responsiveness. Good responsiveness means that a page reacts quickly to the user’s actions. Consider the video example:
An example of good responsiveness vs bad responsiveness
On the left, there’s a significant delay between the click interaction and the actual visual update. This feedback fragmentation causes the user to click multiple times and leads to unexpected layout changes.
On the right, the accordion widget provides immediate feedback, which looks and feels much more coherent.
What is a good INP score
Besides “the faster, the better”, here are the guidelines for the INP values:
- Below 200 milliseconds — a page has good responsiveness
- Between 200 and 500 milliseconds — needs improvement
- More than 500 milliseconds — the responsiveness is optimized poorly
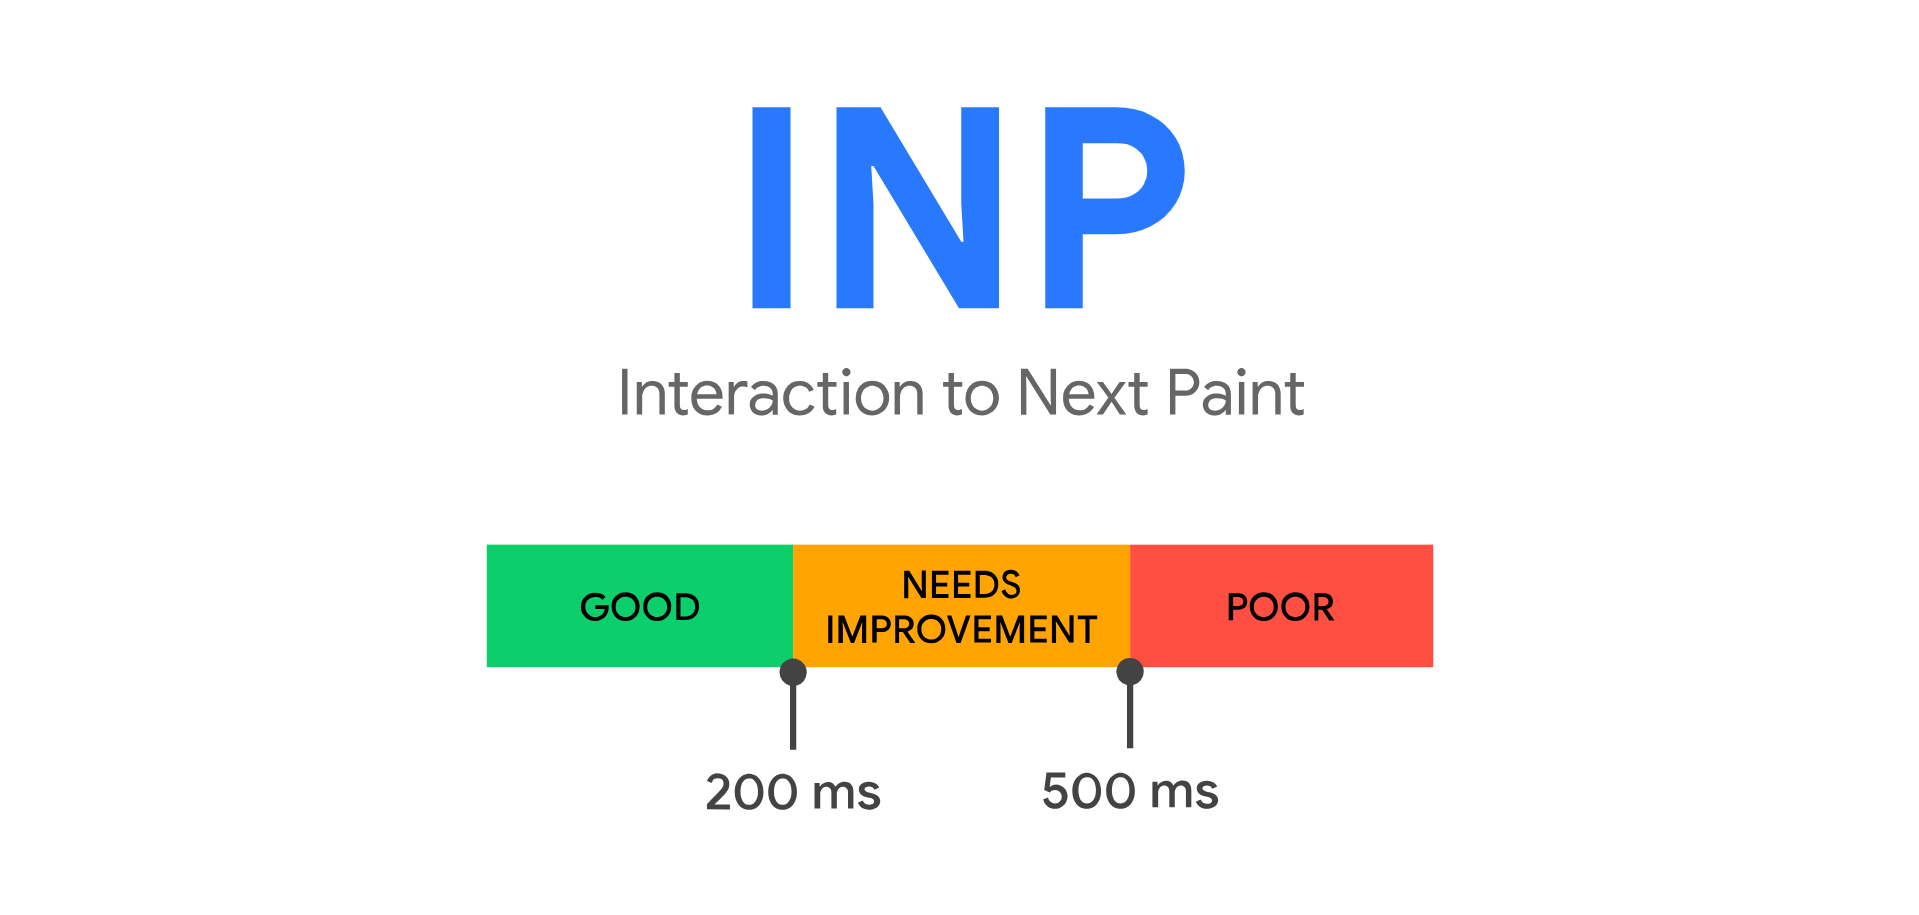 INP score chart
How is INP different from its predecessor, FID
The general difference between these metrics is that FID was designed to measure only the input delay of the first interaction on a page. The newer INP metric observes all interactions on the page.
However, technically speaking, INP is not just “continuous FID” so to speak.
Take a look at the example FID waterfall from the FID article:
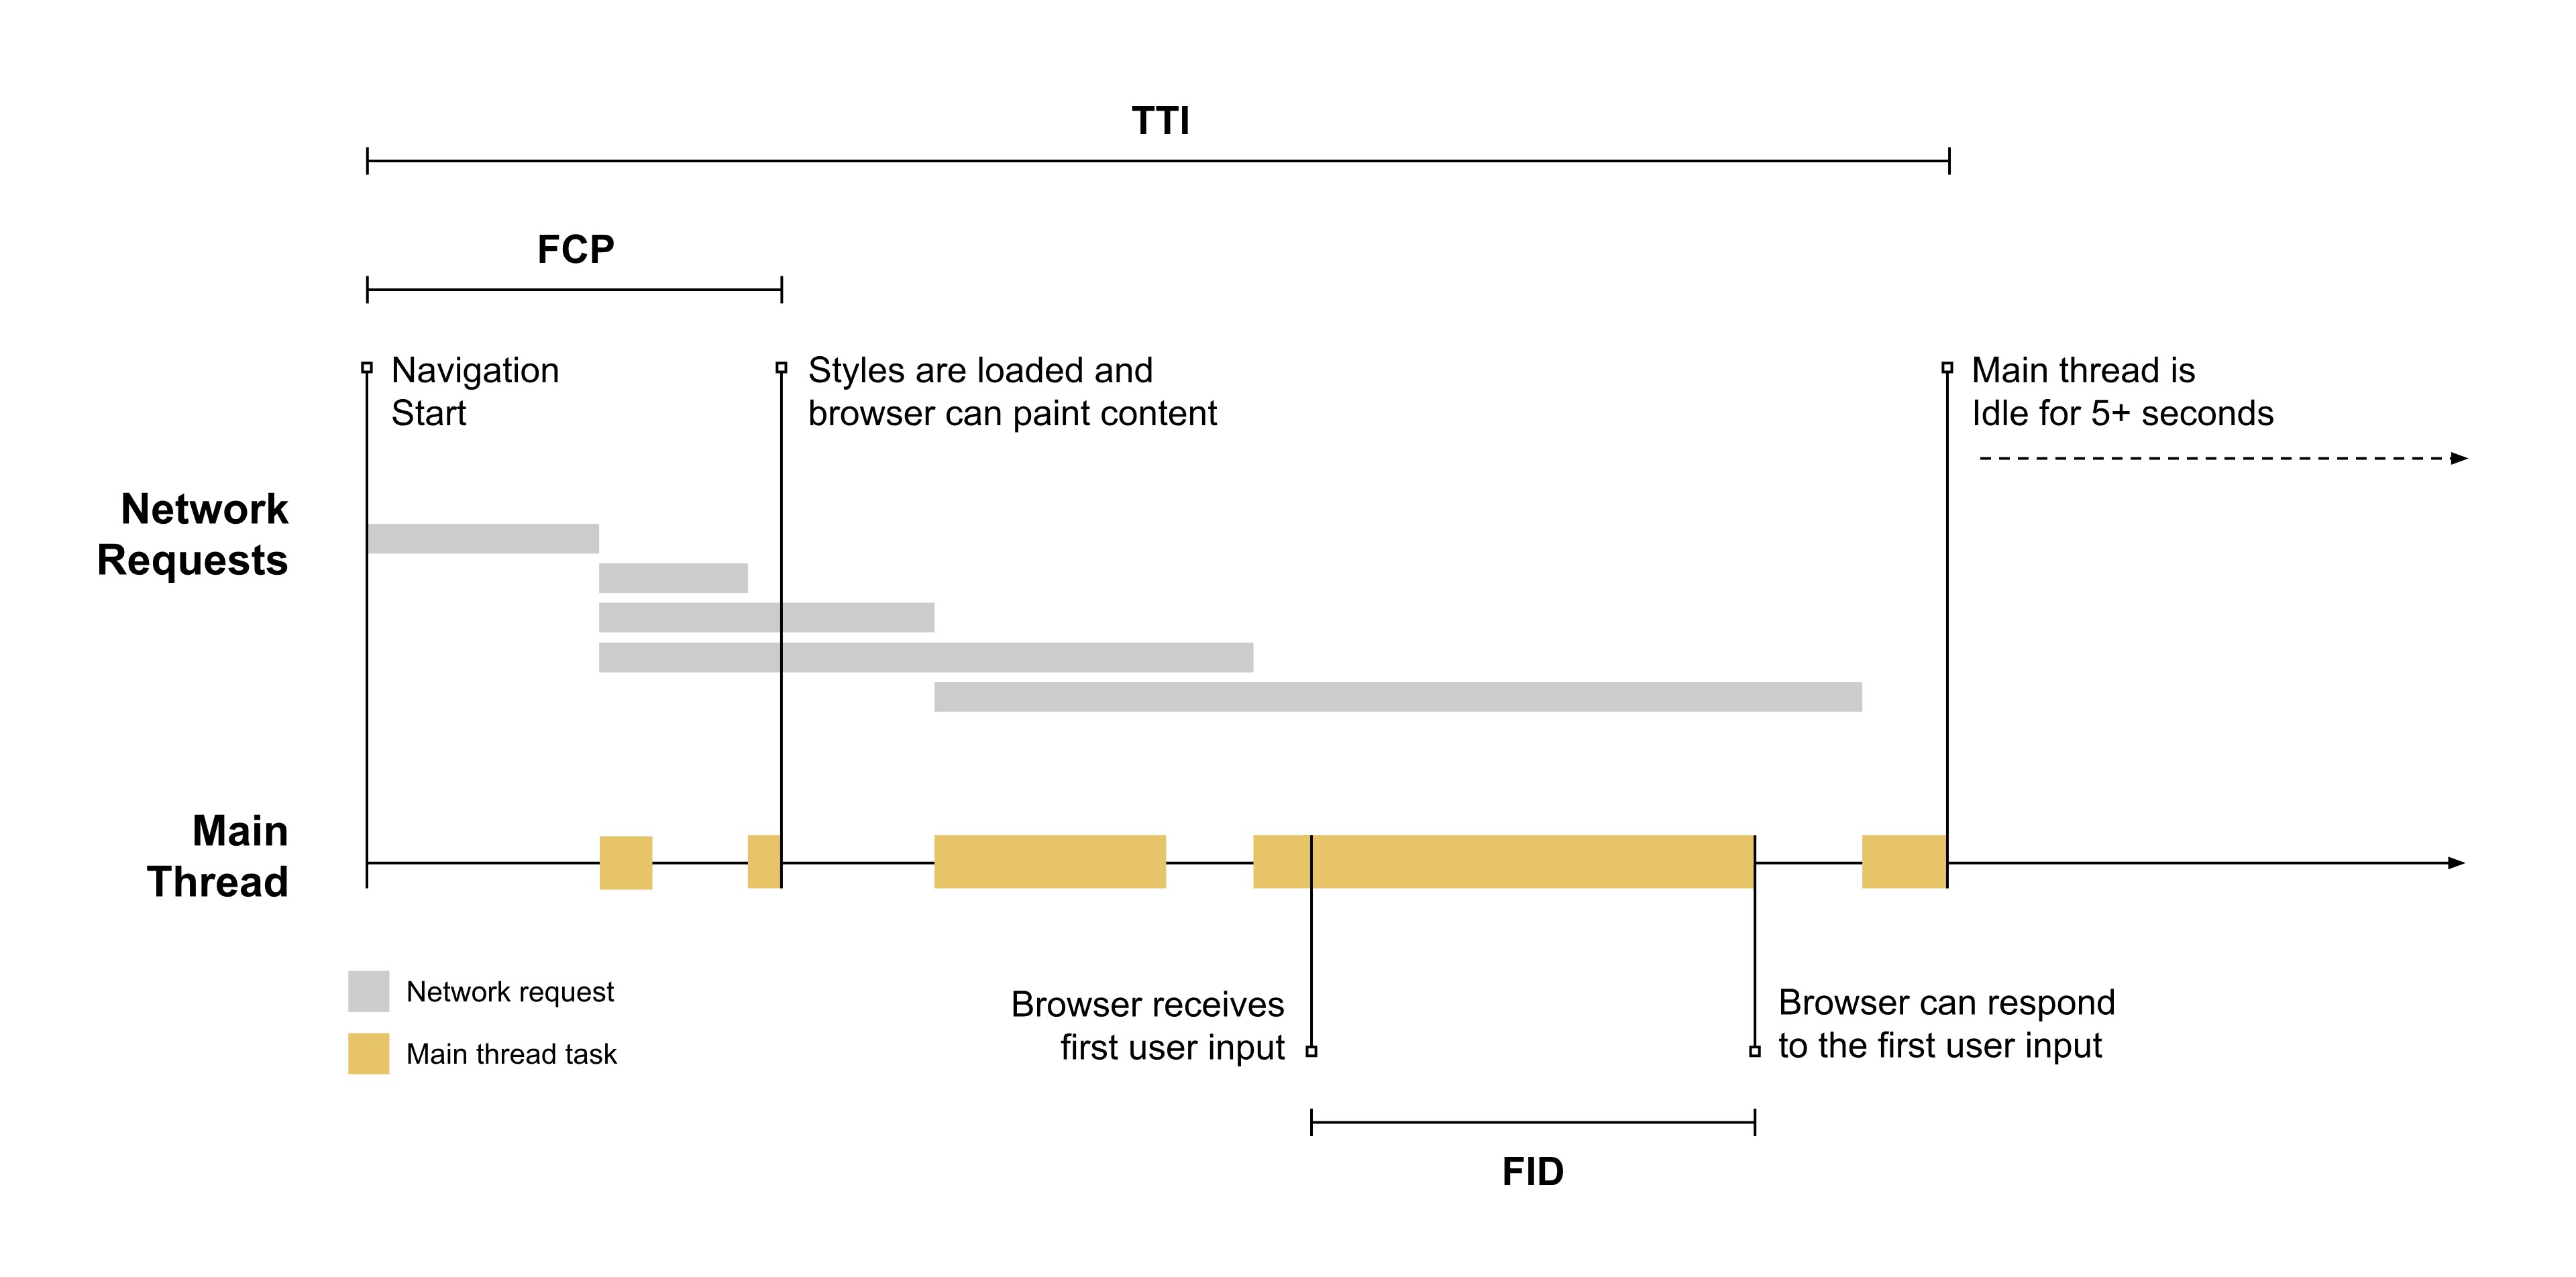 Example page load trace with FCP, TTI, and FID
FID reports the time from when a user interacts with a page to the time when the browser can start processing event handlers bound to the particular type of interaction. That does not guarantee that there would be a visible change on a page.
INP, in turn, targets the whole cycle of interaction from a user-centric perspective. Here’s a diagram of how INP works, given the interaction happens on the main thread. The user makes an input while the main thread is blocked. Input is delayed until the main thread is free, then the event handlers run, rendering and painting happen.
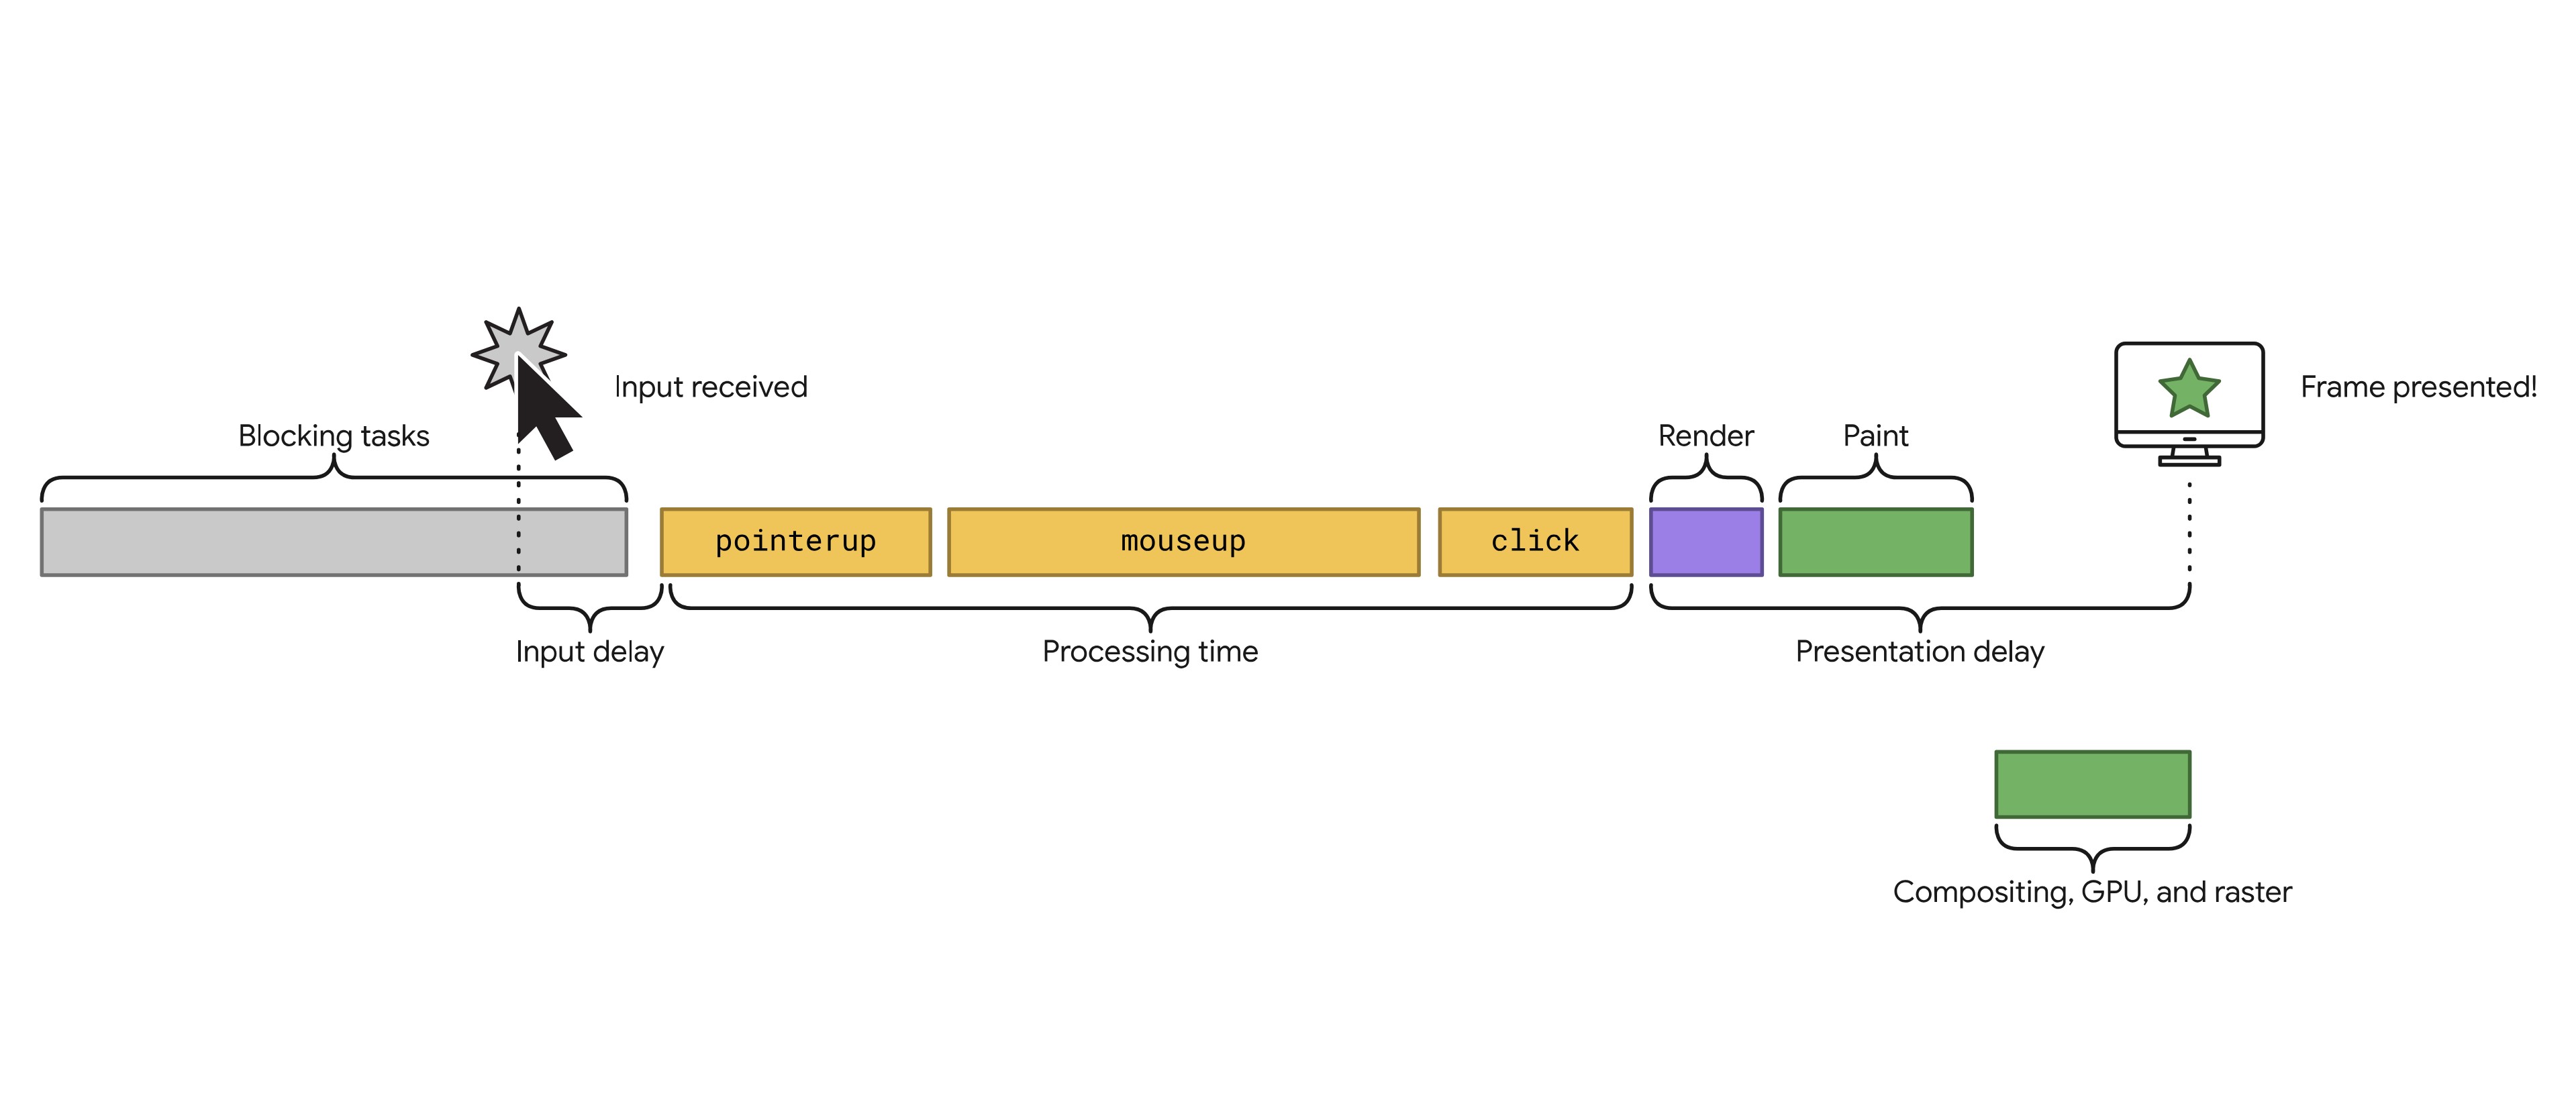 Visual representation of the INP flow
The sum of all these factors results in the INP value for a particular interaction.
How INP affects SEO and lead generation
INP is a part of Core Web Vitals. Core Web Vitals align with what Google’s ranking system seeks to reward.
From a visitor’s perspective, better INP values mean that a website is more user-friendly and responsive which naturally increases user satisfaction thus reducing bounce rate.
Measuring INP, field data from Pagespeed Insights
Due to the nature of this metric, it is difficult to average it out for synthetic tests. If available for your website, you can start exploring INP field data using the CrUX section in PageSpeed Insights.
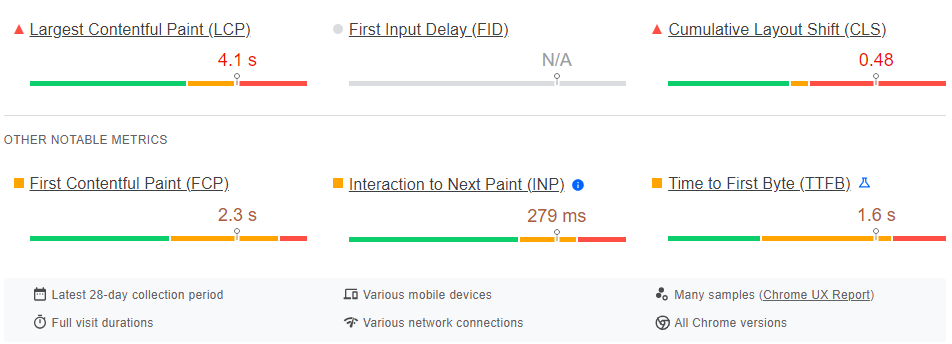 Interaction to Next Paint metric displayed in the CrUX section of PageSpeed Insights. In this example, INP could use some improvement
This value, however, won’t tell the exact bottleneck you have on your website. Instead, the tool reports the value for the 75th percentile of all page views. In other words, the displayed value is the INP for the worst-performing 25% of all page views the tool tracks, excluding outliers.
To find out the exact problematic spots, consider using some kind of Real-User Monitoring solution. Some tools will give you the context around the INP value, its timing, the type of interaction, etc.
Measuring INP: DevTools performance tab
Chrome 127 introduced the Local Metrics section into the DevTools Performance tab. The section reports Core Web Vitals in real-time mode as you navigate through the page.
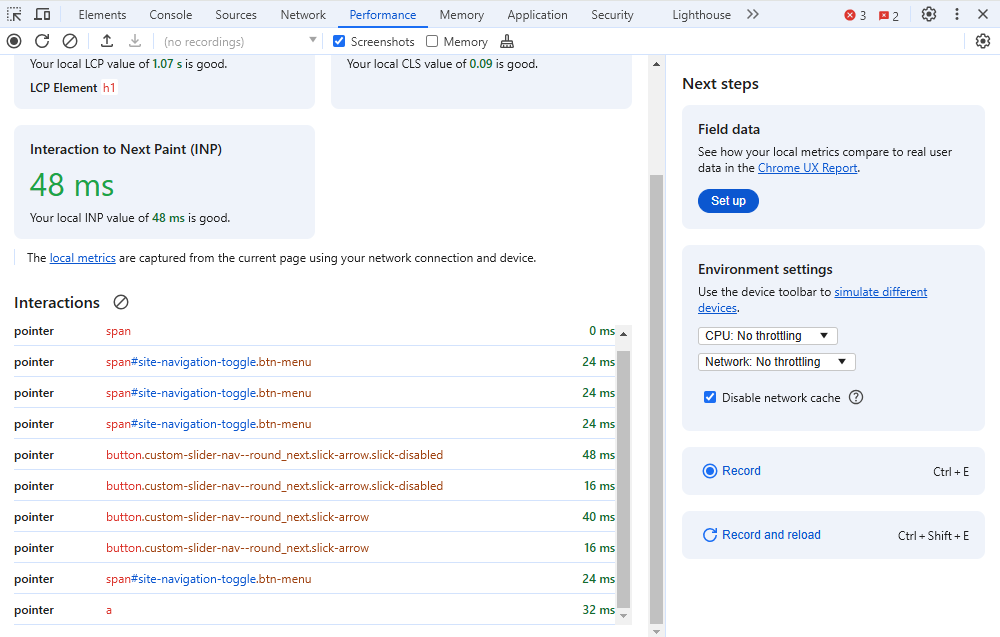 Chrome DevTools Performance tab INP report
What’s interesting for us here is the Interaction to Next Paint tile. It reports the highest value recorded during the current browsing session and also displays a chronological list of interactions with respective elements and interaction types.
Measuring INP: web-vitals JavaScript library
The web-vitals library is a script by Google that you can add to your website and start gathering Core Web Vitals field data from your users. What’s nice about this tool in our case is that we can get detailed INP data using the attribution build of web-vitals and send it to an analytics tool of your choice. Here’s a code snippet example that sends info gathered by the library to GA4. Use it to get a general understanding, and refer to the web-vitals GitHub page to get detailed info.
import {onCLS, onINP, onLCP} from 'web-vitals';

function sendToGoogleAnalytics({name, delta, value, id}) {
  // Assumes the global `gtag()` function exists, see:
  // https://developers.google.com/analytics/devguides/collection/ga4
  gtag('event', name, {
    // Built-in params:
    value: delta, // Use `delta` so the value can be summed.
    // Custom params:
    metric_id: id, // Needed to aggregate events.
    metric_value: value, // Optional.
    metric_delta: delta, // Optional.

    // OPTIONAL: any additional params or debug info here.
    // See: https://web.dev/articles/debug-performance-in-the-field
    // metric_rating: 'good' | 'needs-improvement' | 'poor',
    // debug_info: '...',
    // ...
  });
}

onCLS(sendToGoogleAnalytics);
onINP(sendToGoogleAnalytics);
onLCP(sendToGoogleAnalytics);
How to improve INP
An interaction can be broken down into these three consequent phases:
-
Input delay — the time between when a user interacts with the page and when the browser can start processing the interaction
-
Processing duration — the time it takes for event callbacks to finish
-
Presentation delay — the time it takes for the browser to paint the next frame
Based on a particular case, these could contribute to INP in different proportions, yet all three of them should be checked.
How to improve INP: input delay
Input delays happen when something keeps the main thread busy thus postponing reaction to the user’s input. If big INP values occur during the loading stage of the page, then the same FID improvements apply.
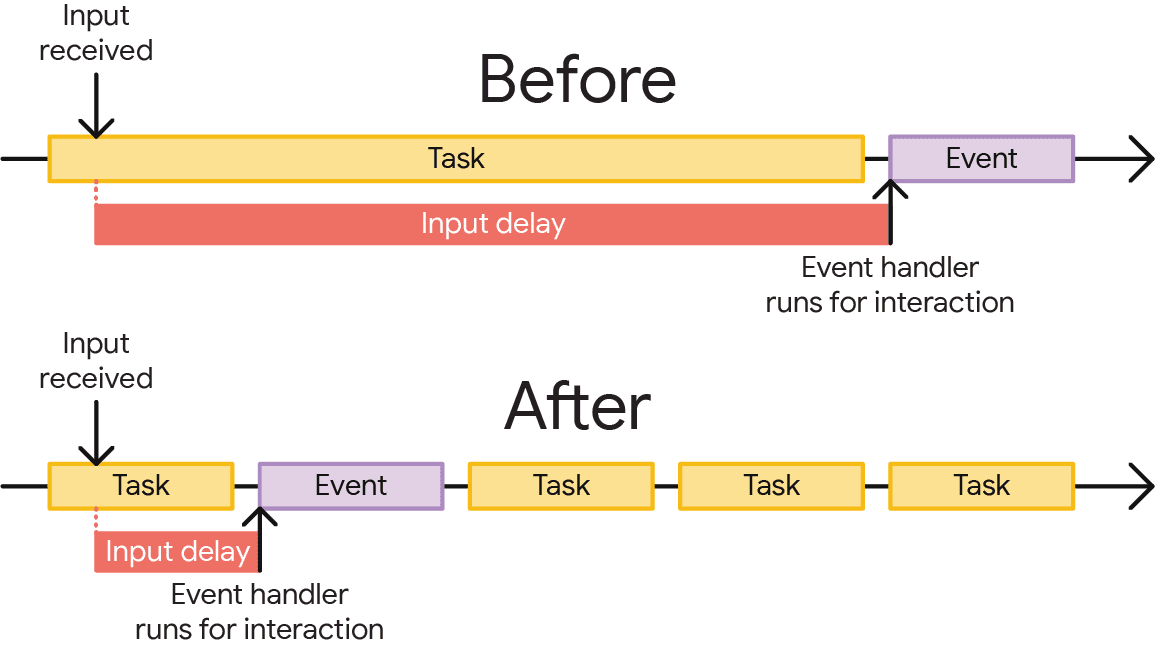 A diagram showing Input Delay
Besides loading assets and parsing code, the main thread might be blocked by recurring tasks introduced by in-house or external analytics tools,
or any other code that is run periodically with async functions like setInterval().
Whatever the source of the thread blocking might be, try to reduce it to the minimum so the interaction can get “noticed” quicker.
How to improve INP: event handlers optimization
Start with evaluating event handlers’ code. Ideally, the less work is done within a callback the better. Chances are you could only get a fraction of improvement because the code is likely to be there for a reason and might not be optimized further.
In this case, you can resort to yielding to the main thread.
In a nutshell, try breaking things up into separate functions and call them using the setTimeout() method.
Simply put, if the next function name is nextCodePiece,
then running setTimeout(nextCodePiece, 0) gives way to other tasks waiting in the main thread queue to be executed.
If there are paint/rendering tasks in the queue, they might get executed faster thus lowering INP.
How to improve INP: Layout thrashing
In Chromium-based browsers, Layout is the process of figuring out the geometric relationships between elements, and their positions on the page. It depends on the number of DOM elements that require layout, and on the complexity of those layouts.
Layout can be triggered by different actions, but the most frequent and developer-determined are:
- Changing CSS properties that alter the geometry of an element (such as width and height)
- Getting/setting layout-triggering properties via JS
It is crucial to keep layouts in check, otherwise they may pile up and block a big chunk of the main thread. Consider the following snippet:
function resizeAllParagraphsToMatchBlockWidth(paragraphs, box) {
  // Puts the browser into a read-write-read-write cycle.
  for (let i = 0; i < paragraphs.length; i++) {
    paragraphs[i].style.width = `${box.offsetWidth}px`;
  }
}
The snippet above runs through paragraphs and assigns each of them the width of an element called a box.
This seems harmless at first glance, but with each width assignment,
the browser forces itself to apply style changes and run the layout in the next iteration,
even though the width of the box element might not change at all.
This is called Layout thrashing.
A good practice would be to keep reading and writing separate. The snippet above could be rewritten as follows:
function resizeAllParagraphsToMatchBlockWidth(paragraphs, box) {
  // Read.
  const width = box.offsetWidth;

  // Now write.
  for (let i = 0; i < paragraphs.length; i++) {
    paragraphs[i].style.width = `${width}px`;
  }
}
How to improve INP: presentation delay
Usually, the presentational part is not something we have total control over. But still, the rule of thumb here could go as the following: fewer elements — faster rendering. Make sure that the page’s DOM tree is optimized. For example, if your CSS heavily relies on “wrappers” that introduce unnecessary element nesting, consider flattening the DOM tree.
Another approach to keep in mind is lazy-loading your HTML, especially if the page has empty “template” elements to be populated later.
It is also possible to follow the lazy-loading concept with CSS. The content-visibility property allows deferring the rendering process for off-screen elements until the moment they are scrolled to.
How to improve INP: an example
I prepared an example for us to look at: a simple WYSIWYG text editor that counts words and characters. This is a fork of a simple editor I found online.
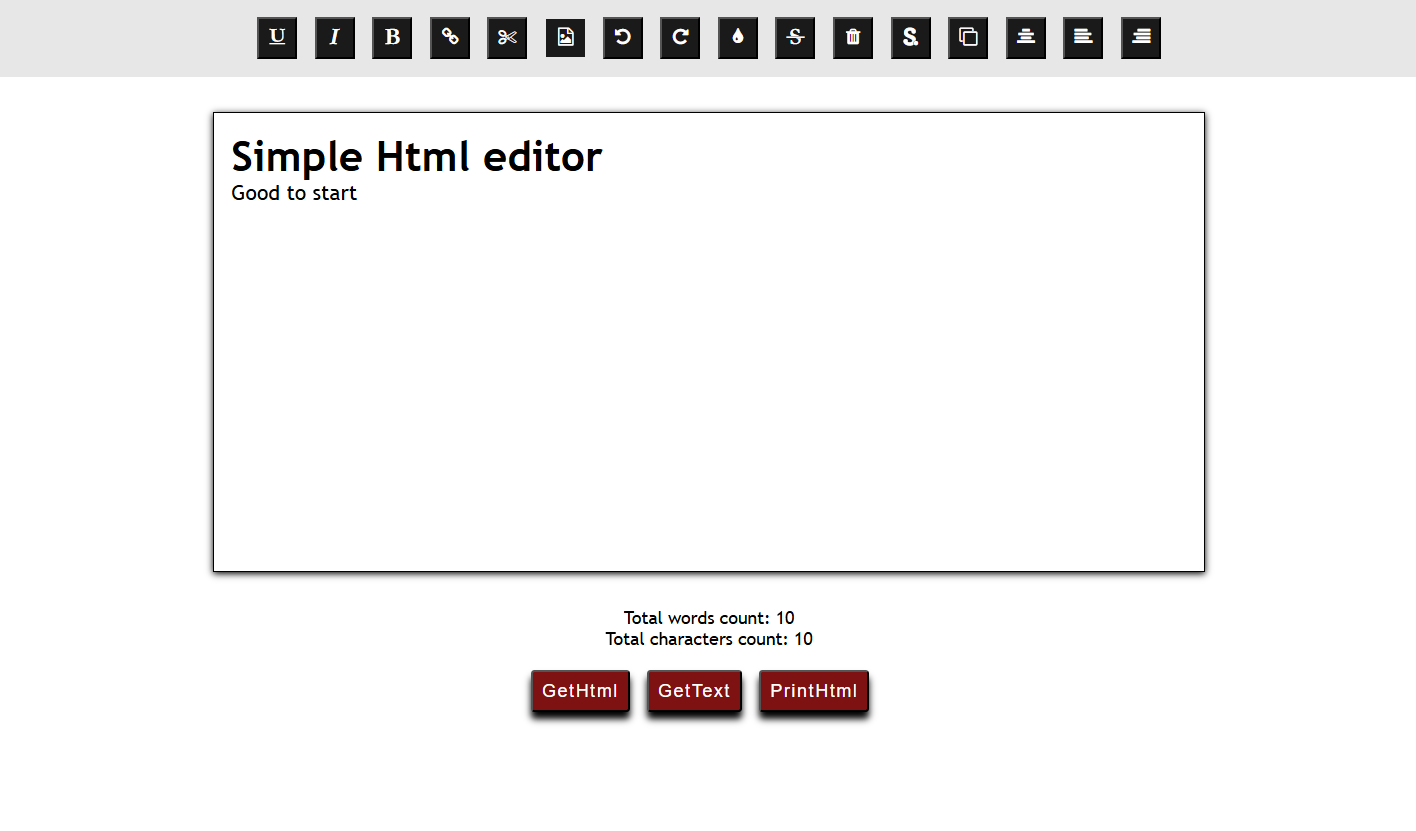 A simple WYSIWYG text editor that counts words and characters
Let’s open an unoptimized version together with the DevTools performance tab to see the INP:
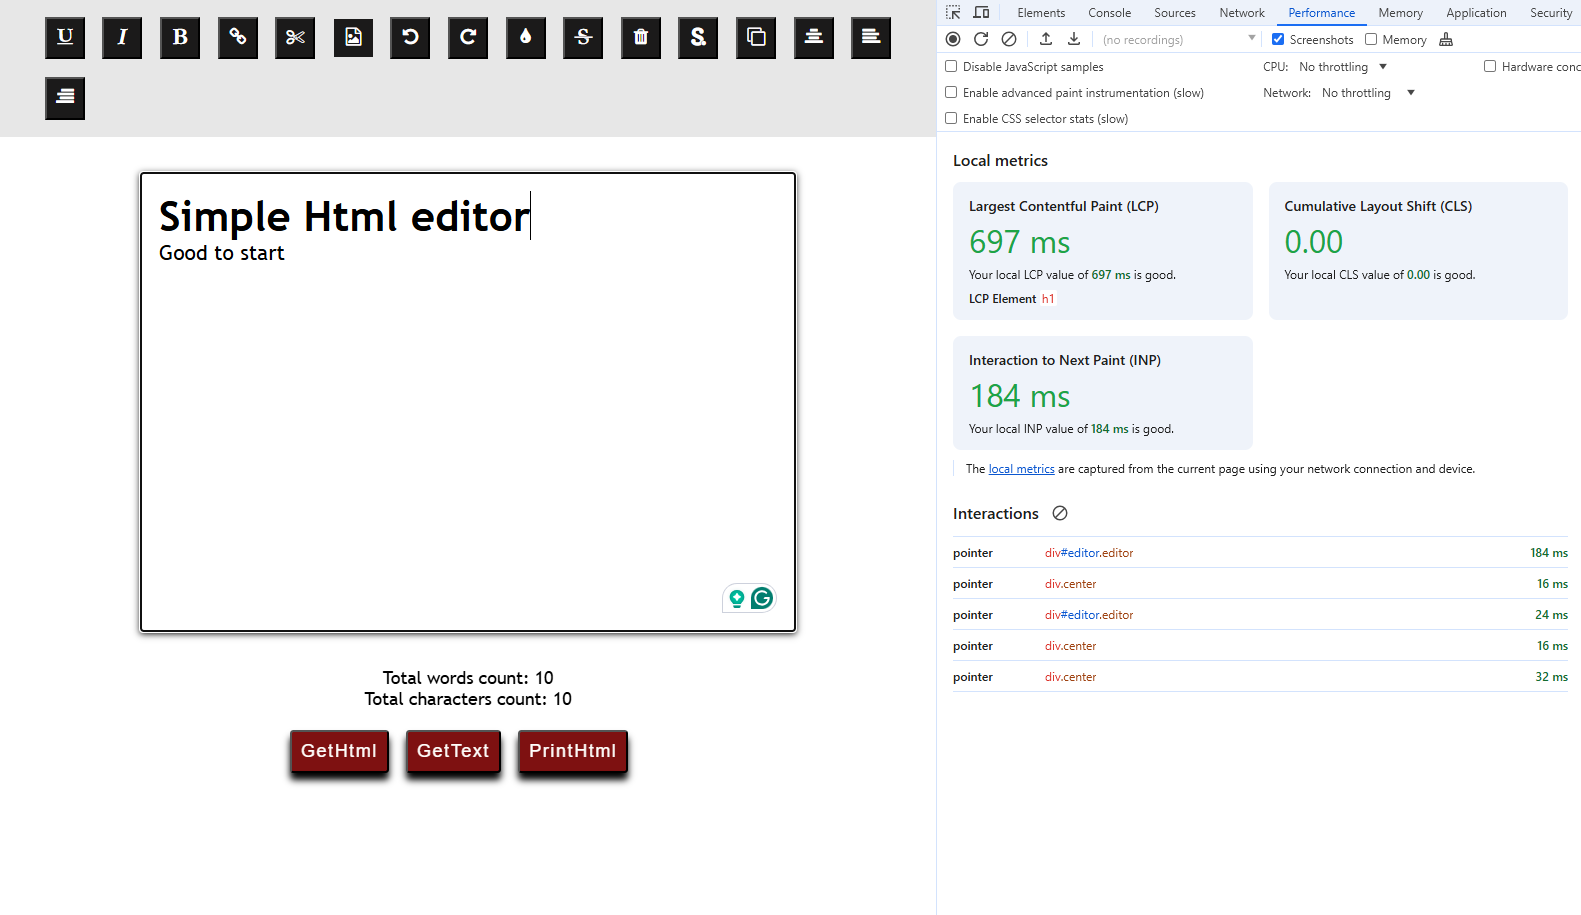 DevTools INP value
Let’s start typing and see how the page responds. Using the word “Hello” as an example:
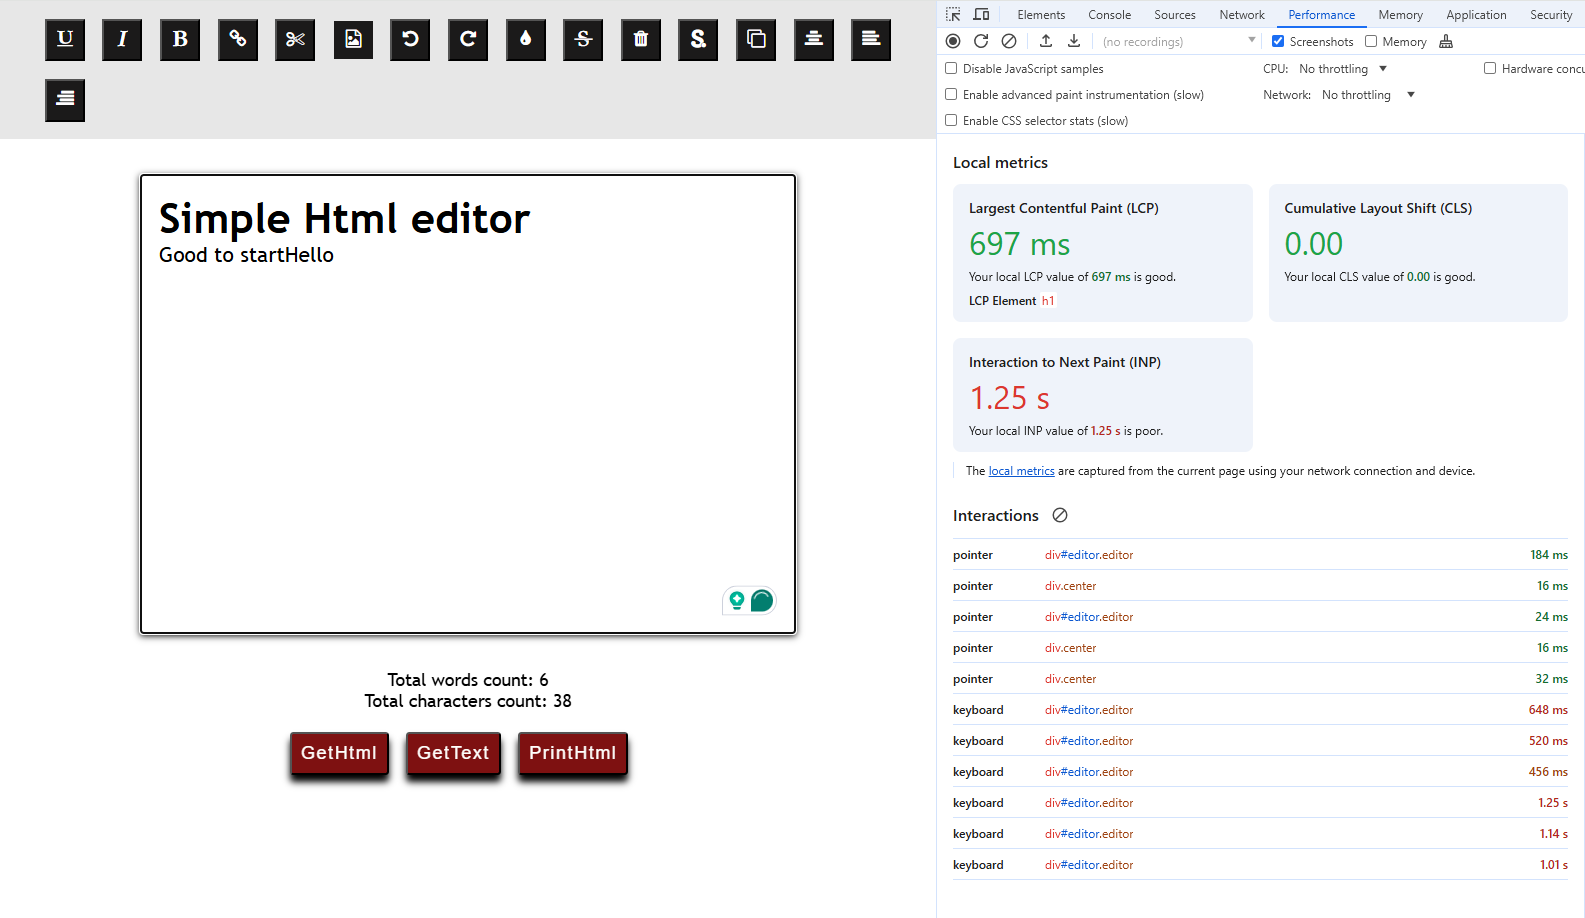 DevTools with a big INP value
We get poor INP values for each keyboard interaction.
But what’s more important for the end user — the page just freezes during and after typing.
Let’s reload the page and record the performance profile to identify the exact bottleneck in the code.
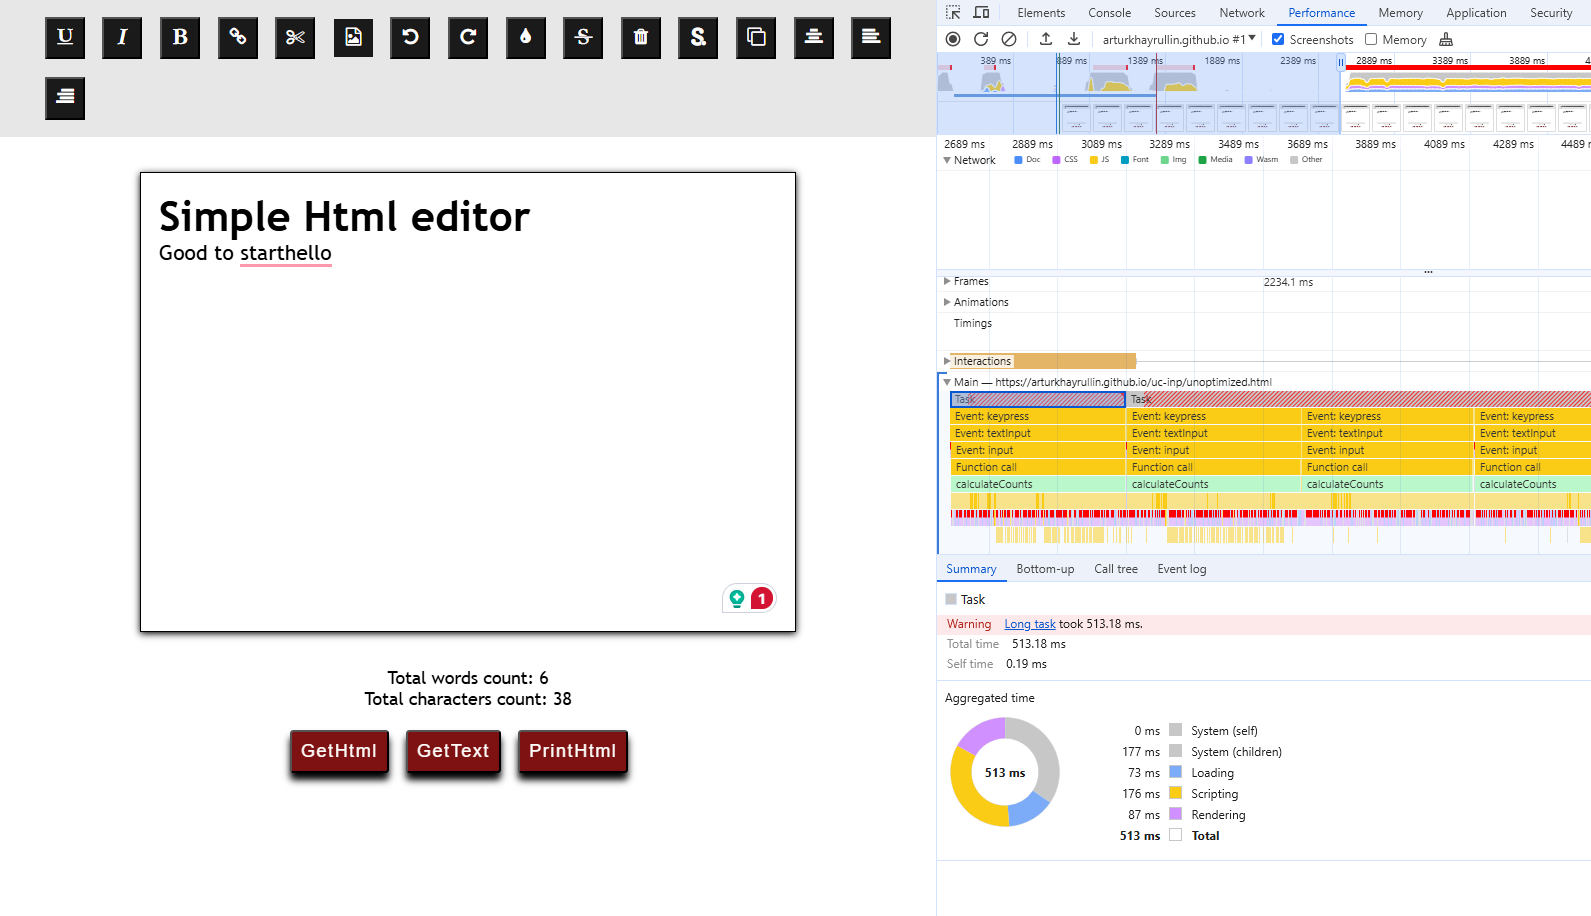 Chrome DevTools showing performance bottleneck
For each input event in the profile, the calculateCounts function is called which takes up all the event processing time.
Let’s examine the function, it is located in the script-unoptimized.js file at line 8:
function calculateCounts() {
  for (let i=0; i < 2000; i++) {
    wordsCount.innerHTML = editor.innerText.trim().split(/\s+/).length;
    charactersCount.innerHTML = editor.innerText.length;
  }
}

document.getElementById('editor').addEventListener('input', calculateCounts, false);
The function tries to update the UI each time the “editor” content is changed. As we can see, the event handler function is obnoxiously unoptimized to represent a potentially slow algorithm.
Remember we discussed splitting event callback functions into several parts giving way to other main thread tasks? Let’s do exactly that by debouncing the input event.
Debouncing is a term that comes from electronics. The goal of debouncing is to remove unwanted input noise from buttons, switches, or other user input.
Talking in coding terms, we’re going to delay the callback execution until the user stops typing. In our case, there’s no practical need to know the exact amount of words and characters right away.
Take a look at the debounced version of the event handler:
function debounce(func, timeout = 300){
  let timer;
  return (...args) => {
    clearTimeout(timer);
    timer = setTimeout(() => { func.apply(this, args); }, timeout);
  };
}

function calculateCounts() {
  for (let i=0; i < 2000; i++) {
    wordsCount.innerHTML = editor.innerText.trim().split(/\s+/).length;
    charactersCount.innerHTML = editor.innerText.length;
  }
}

const debouncedCalculateCounts = debounce(() => calculateCounts());

document.getElementById('editor').addEventListener('input', debouncedCalculateCounts, false);
This method delays the calculateCounts() function execution to fire only once, 300 milliseconds after the last input event.
Let’s see how this debounced example performs:
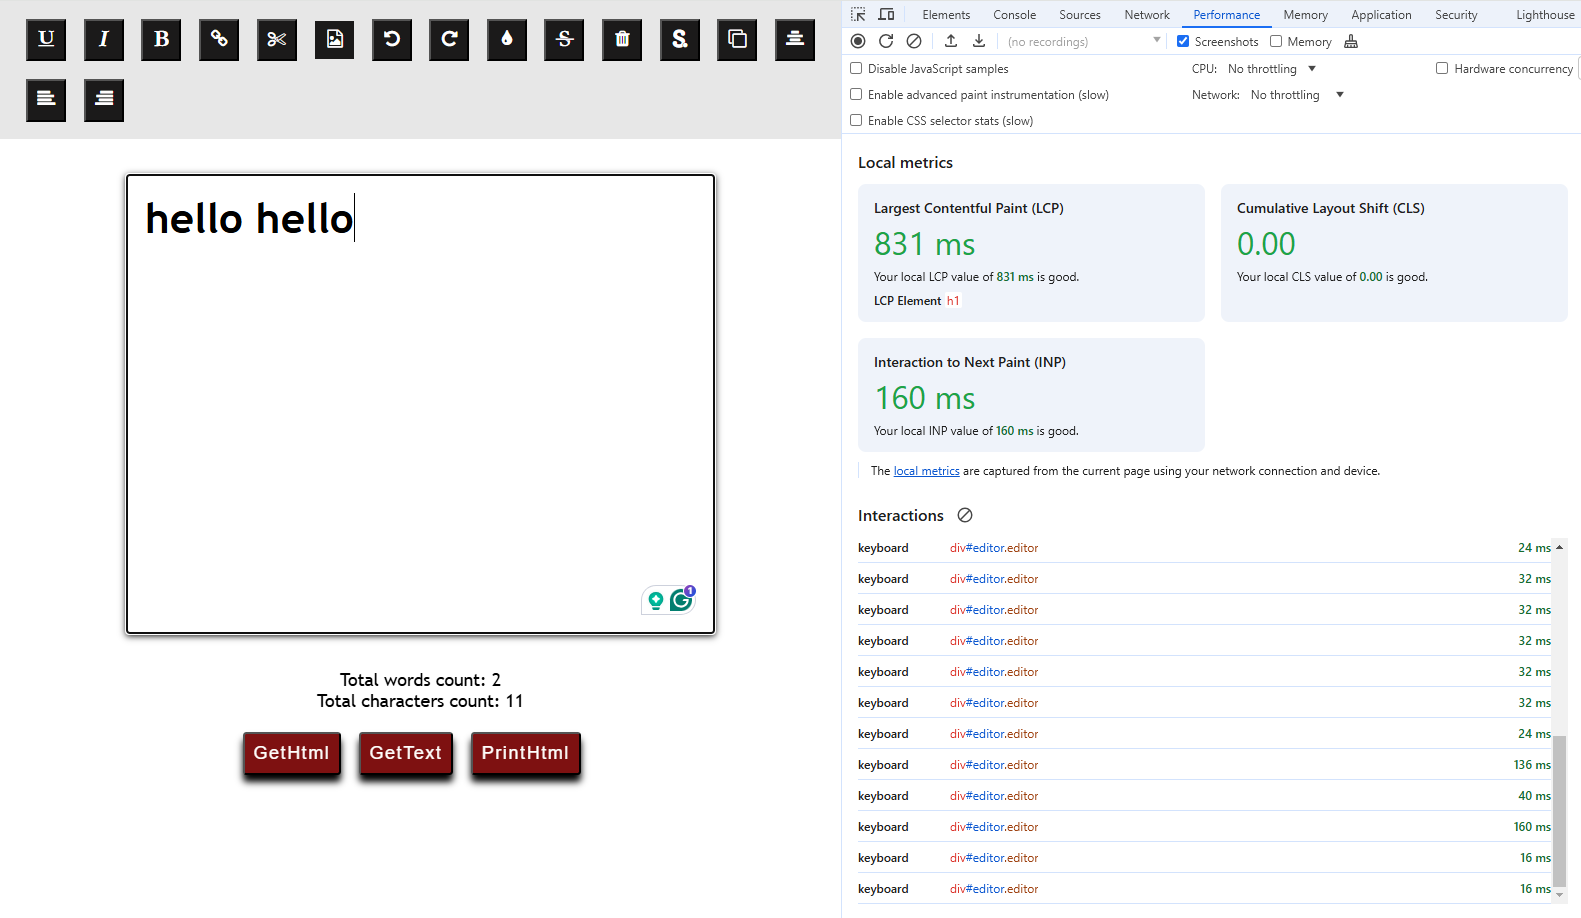 DevTools Performance tab with good INP values
The INP values for a single keyboard event have improved drastically. No computations are made in response to every keypress event and that’s why the browser is easily able to render new frames after each keystroke. As a result, the page became much more usable because the chance of freezing is much lower now.
But why not zero?
We optimized the amount of times we call an expensive function, but did not optimize the function itself.
If a user continues typing starting from, say, 301ms since the last keypress,
the interaction may happen while the main thread is busy with the heavy calculateCounts function.
To get the best performance possible, it is better to use improvements like debouncing not as a cover-up,
but as an addition to already optimized functions, if possible.
Conclusion
In my opinion, INP now being a part of Core Web Vitals is an important step towards better user experience. Optimizing this new metric is likely to be an iterative process — successfully fixing one big issue could drive your attention to freshly uncovered smaller problems. Ultimately leading to satisfied visitors.