Optimizing apps using React Developer Tools
This article aims to provide an easy-to-follow tutorial on the basics of optimizing React apps using React DevTools. We will put together a simple unoptimized version of the ToDo app and gradually improve it while uncovering React DevTools’ functionality.
What is React DevTools?
React Developer Tools is a set of tools that represent your app’s internals in a convenient fashion. It offers a visual representation of the component hierarchy, real-time info on state and props updates, and profiling tools to inspect when and why components render.
How to install React Developer Tools
React DevTools come in the form of a browser extension for Chrome, Edge and Firefox, and as an npm package.
In this tutorial, we’ll debug with Chrome. Download the extension from the Chrome Web Store to get started.
For other browsers like Safari etc., install the react-devtools npm package
and inject the script into your website’s <head> tag.
After installing the extension, you should see Components and Profiler panels in your browser’s DevTools:
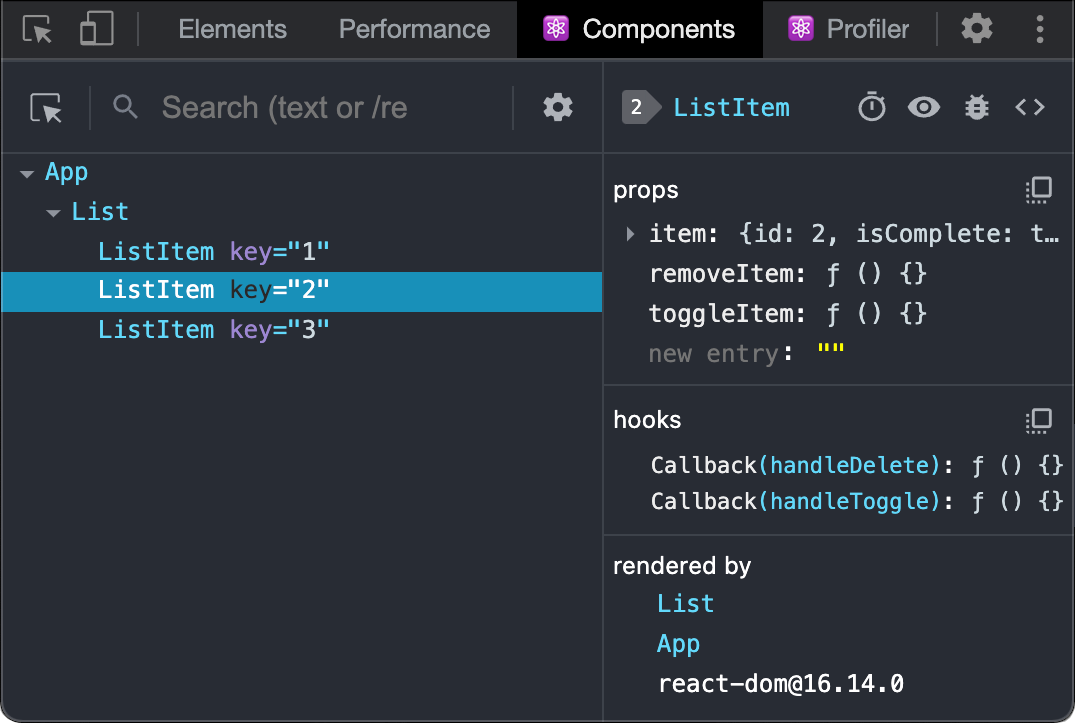 React Developer Tools, Components tab
React DevTools: Components tab
I’d like this tutorial to be practice-driven, so let’s put the tools to the test by analyzing our simple app. The app is bootstrapped with create-react-app, so feel free to recreate the structure and copy code pieces provided in this article. It looks as follows:
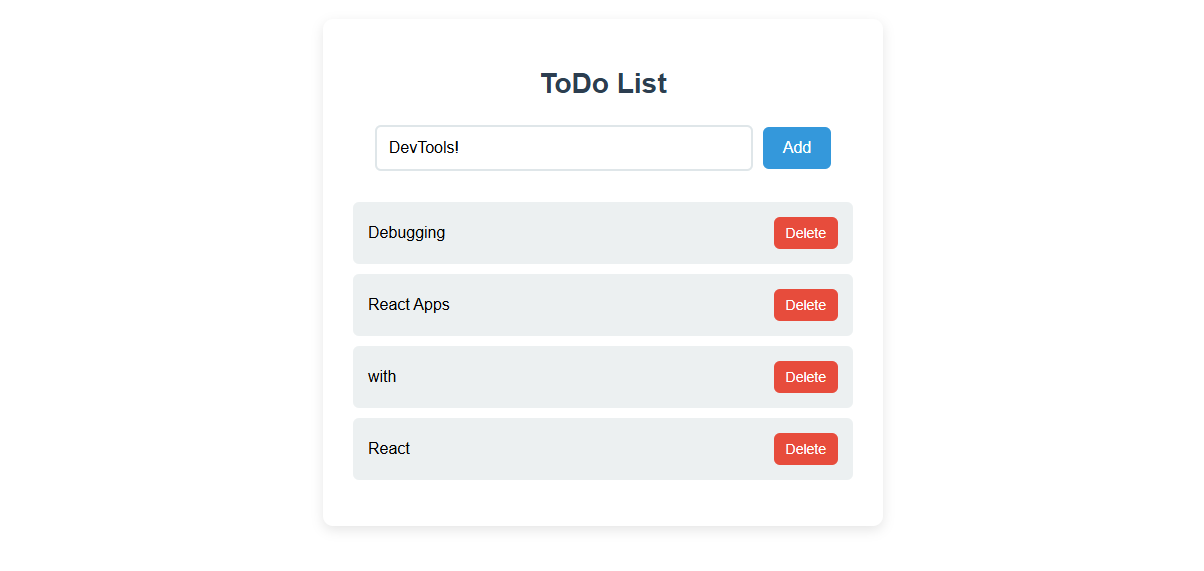 Simple ToDo List app concept
Open Chrome Developer tools, and you will see two new tabs: Components and Profiler.
 React Developer Tools, Components tab
The Components tab is Chrome’s Elements Inspector look-alike but for React. Highlight an element in the hierarchy tree (left panel) to see its props, hooks, and other information (right panel).
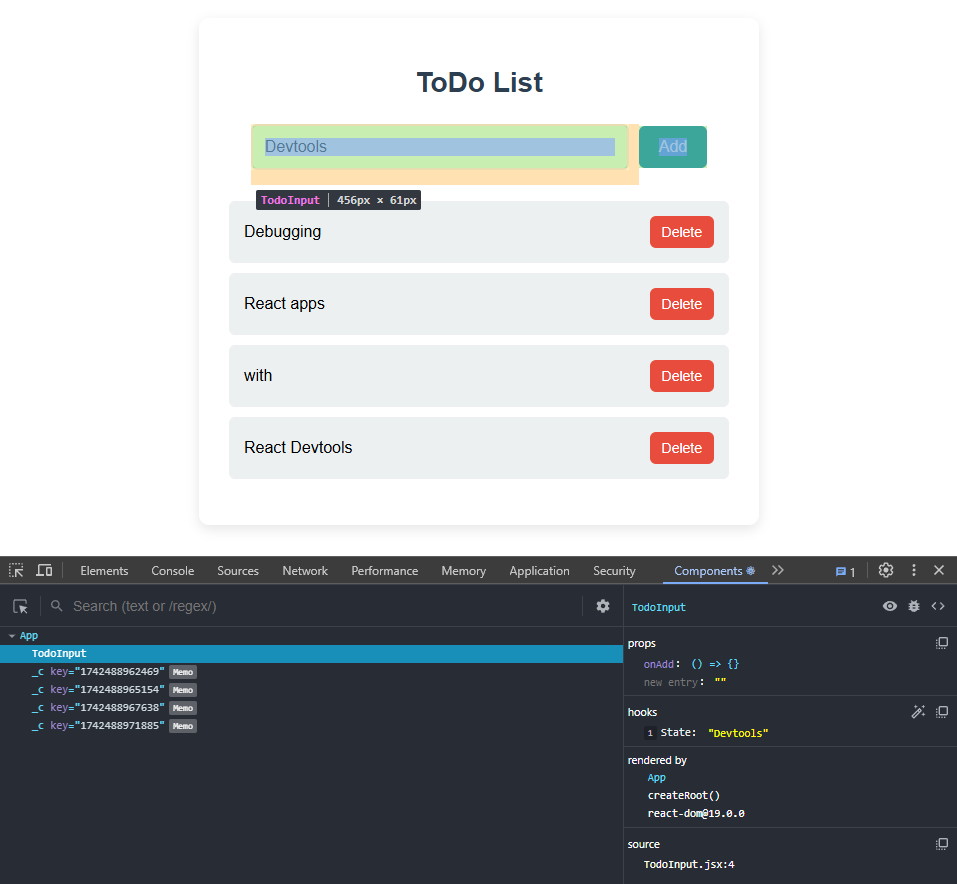
You can change props in real time like in the screenshot below. If the prop is a function, clicking redirects to the Sources panel to the respective line of code. This makes testing edge cases easier.
Hover over a page element using the cursor icon left of the search field to highlight its component in the React DevTools tree. To reverse it, select a component in the tree and click the eye icon in the right panel to highlight the element in the Elements tab.
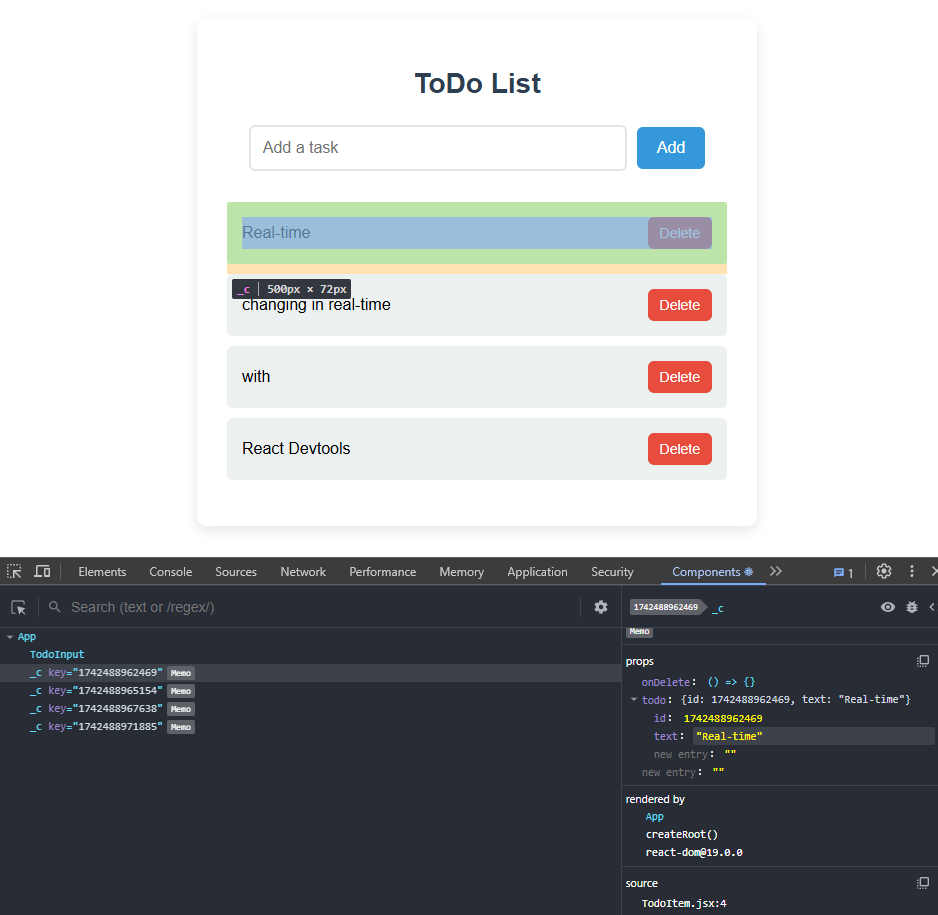 Changing component props in real-time using React DevTools
React DevTools: Profiler tab
The main goal of the Profiler tab is to record what happens on the page and provide information about the performance of the components.
Start profiling by clicking the “record” icon on the top-left on the Profiler tab. Perform the actions that you want to evaluate and click the icon again. This results in the chart called “flamegraph” like in the screenshot below.
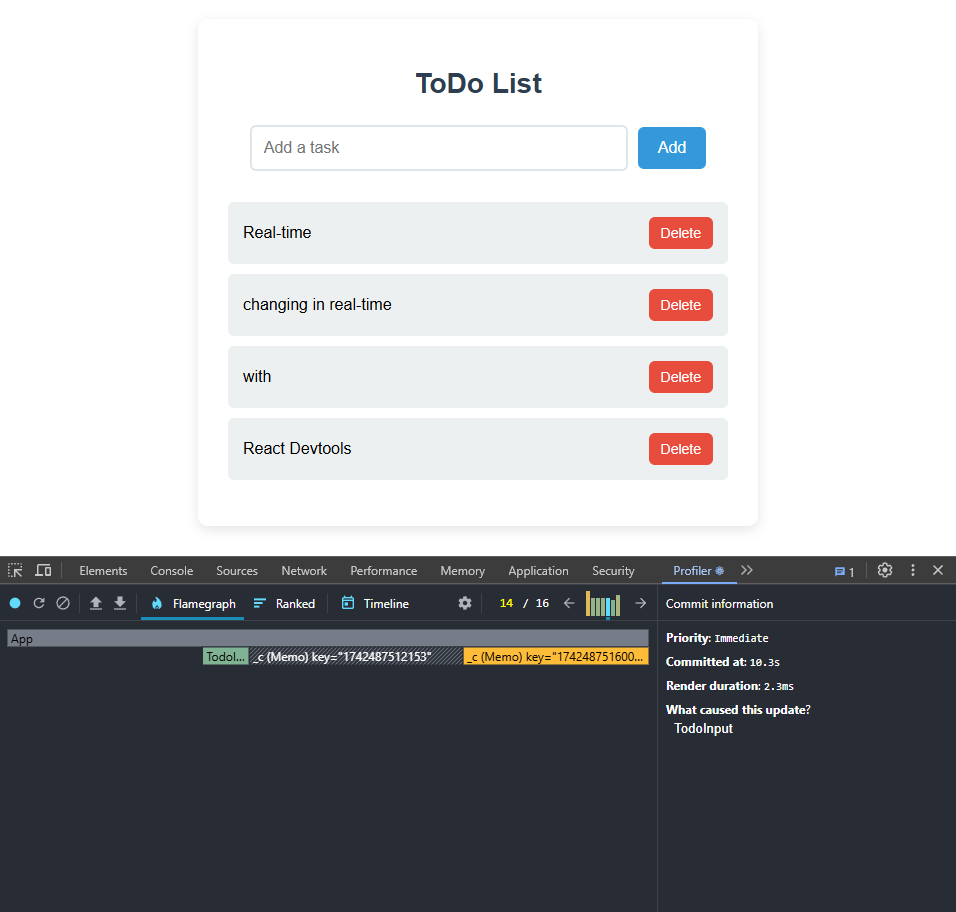 React DevTools Profiling tab
The Profiler records all the commits to the DOM of the page that happened during the recording. In the screenshot above, there are 16 commits and the 14th commit is being viewed.
A commit itself consists of one or more renders. Slow-loading component renders are yellow, fast-loading are blue, and gray bars are the components that didn’t render during this commit.
In this tutorial, we will rely on the “Record why each component rendered while profiling” setting. Click the gear icon on the left of the commits slider to enable it.
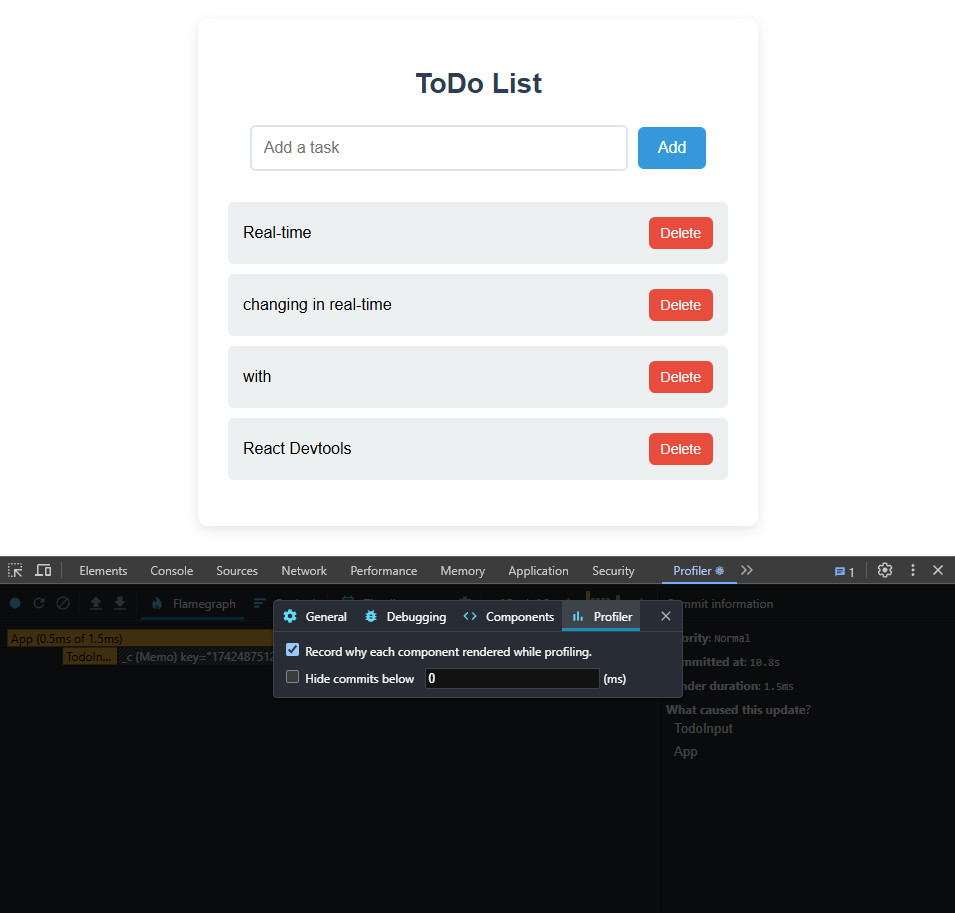 Record why each component rendered while profiling setting, React DevTools
Improving performance using React DevTools: An example
Here’s the code for the initial version of the app:
// App.jsx
import React, { useState } from 'react';
import './App.css';

function App() {
  const [todos, setTodos] = useState([]);
  const [inputValue, setInputValue] = useState('');

  const addTodo = () => {
    if (inputValue.trim()) {
      setTodos([...todos, { text: inputValue, id: Date.now() }]);
      setInputValue('');
    }
  };

  const deleteTodo = id => {
    setTodos(todos.filter((todo) => todo.id !== id));
  };

  console.log('App rendered');

  return (
    <div className="app">
      <h1>ToDo List</h1>
      <input
        type="text"
        value={inputValue}
        onChange={e => {
          setInputValue(e.target.value);
          console.log('Input changed');
        }}
        placeholder="Add a task"
      />
      <button onClick={addTodo}>Add</button>
      <ul>
        {todos.map(todo => (
          <li key={todo.id}>
            {todo.text}
            <button onClick={() => deleteTodo(todo.id)}>Delete</button>
          </li>
        ))}
      </ul>
    </div>
  );
}

export default App;
Step 1: Initial React DevTools profiler analysis
Let’s start by gathering some info from Profiler. I started profiling the app, typed “test” 2 times, added the item, and then deleted one of the items.
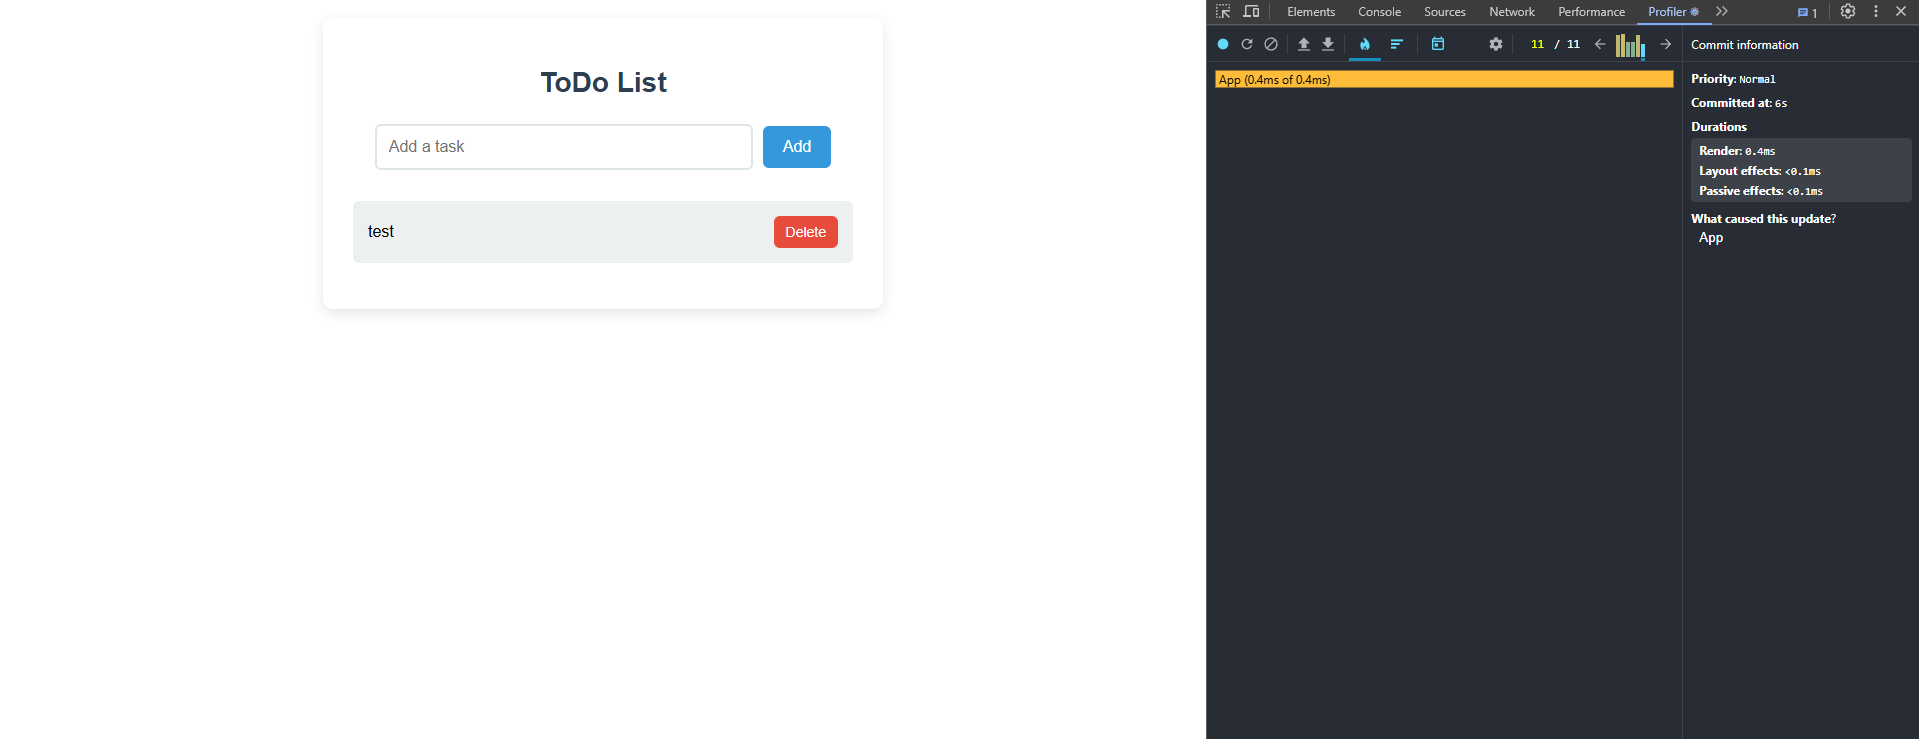 React DevTools Profiler opened in Flame Graph mode
This resulted in 11 commits, and the App component got re-rendered in each commit:
- 8 commits total for each input field change
- 2 commits for each click of the “Add” button
- 1 commit for to-do item removal
We can’t gather more information about the components rendering at this point — we’ve got only one component that contains the whole app. And every time something changes or triggers a hook, the whole App component gets re-rendered. Let’s move the code for a single to-do item into a separate component.
Step 2: Separating to-do items
Separating the <li> item into its component:
// TodoItem.jsx
import React from 'react';

function TodoItem({ todo, onDelete }) {
  console.log(`Rendering TodoItem ${todo.id}`);

  return (
    <li>
      {todo.text}
      <button onClick={() => onDelete(todo.id)}>Delete</button>
    </li>
  );
}


export default TodoItem;

// App.jsx
import React, { useState } from 'react';
import TodoItem from './TodoItem';
import './App.css';

function App() {
  const [todos, setTodos] = useState([]);
  const [inputValue, setInputValue] = useState('');

  const addTodo = () => {
    if (inputValue.trim()) {
      setTodos([...todos, { text: inputValue, id: Date.now() }]);
      setInputValue('');
    }
  };

  const deleteTodo = id => {
    setTodos(todos.filter((todo) => todo.id !== id));
  };

  console.log('App rendered');

  return (
    <div className="app">
      <h1>ToDo List</h1>
      <input
        type="text"
        value={inputValue}
        onChange={e => {
          setInputValue(e.target.value);
          console.log('Input changed');
        }}
        placeholder="Add a task"
      />
      <button onClick={addTodo}>Add</button>
      <ul>
        {todos.map(todo => (
          <TodoItem key={todo.id} todo={todo} onDelete={deleteTodo} />
        ))}
      </ul>
    </div>
  );
}

export default App;
Performing the same testing steps leads to the following picture:
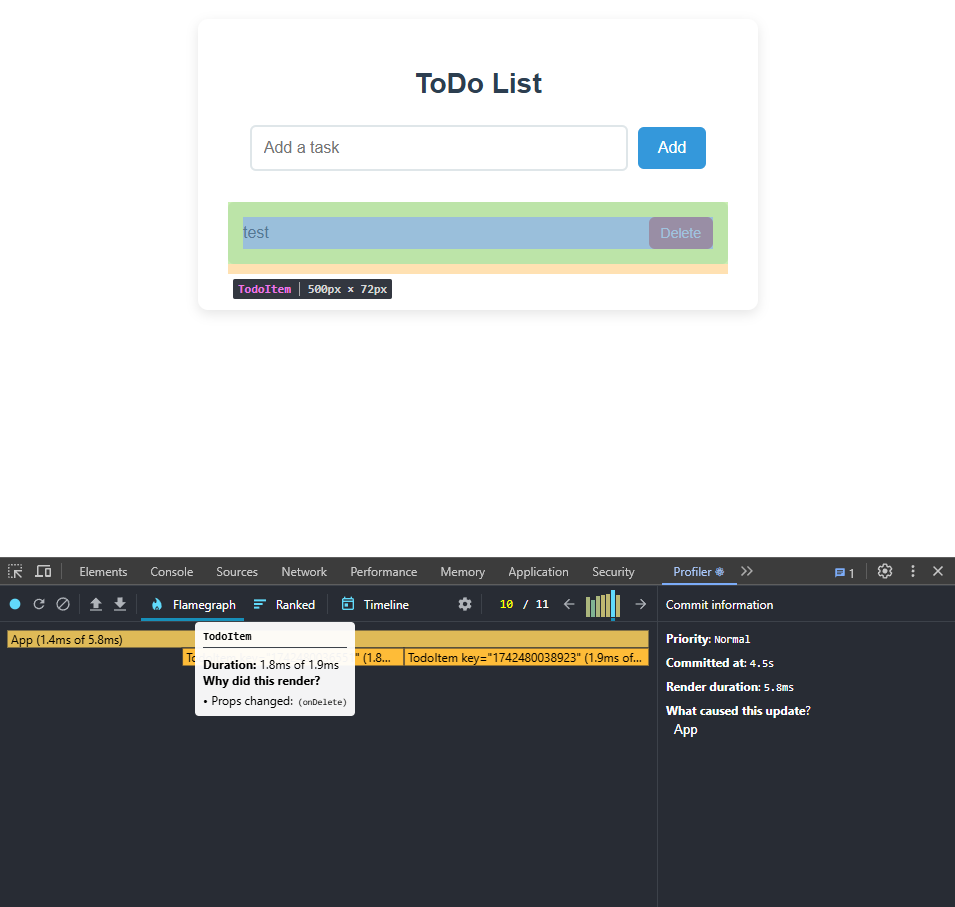 React DevTools flamegraph with a few rendered components
Good! Although the App component still gets re-rendered in each commit, now we have more control over the items moved into the separate component.
I recorded adding two independent TodoItem component instances, but when adding the second one,
the first item (obscured by a tooltip on the screenshot) got re-rendered too.
Hovering the item gives us more details: re-rendering happened due to the change of the onDelete prop.
Step 3: Add memoization and stabilize functions
Each time the App component re-renders, new addTodo and deleteTodo functions are created.
Even though the function JS code stays the same, the TodoItem component registers this as a prop change and re-renders.
We can use the useCallback hook to “cache” functions and pass them as arguments into the TodoItem component.
Let’s also implement memoization within the TodoItem component itself.
React.memo() allows a component to skip re-rendering when its props are unchanged,
even if its parent component is re-rendered (which is App in our case).
// TodoItem.jsx
import React from 'react';

const TodoItem = React.memo(({ todo, onDelete }) => {
  console.log(`Rendering TodoItem ${todo.id}`);

  return (
    <li>
      {todo.text}
      <button onClick={() => onDelete(todo.id)}>Delete</button>
    </li>
  );
});

export default TodoItem;

// App.jsx
import React, { useState, useCallback } from 'react';
import TodoItem from './TodoItem';
import './App.css';

function App() {
  const [todos, setTodos] = useState([]);
  const [inputValue, setInputValue] = useState('');

  const addTodo = useCallback(() => {
    if (inputValue.trim()) {
      setTodos((prev) => [...prev, { text: inputValue, id: Date.now() }]);
      setInputValue('');
    }
  }, [inputValue]);

  const deleteTodo = useCallback(id => {
    setTodos((prev) => prev.filter((todo) => todo.id !== id));
  }, []);

  console.log('App rendered');

  return (
    <div className="app">
      <h1>ToDo List</h1>
      <input
        type="text"
        value={inputValue}
        onChange={e => {
          setInputValue(e.target.value);
          console.log('Input changed');
        }}
        placeholder="Add a task"
      />
      <button onClick={addTodo}>Add</button>
      <ul>
        {todos.map(todo => (
          <TodoItem key={todo.id} todo={todo} onDelete={deleteTodo} />
        ))}
      </ul>
    </div>
  );
}

export default App;
After running the test with useCallback only, we see that the TodoItem component still re-renders,
but now for a different reason (The parent component rendered):
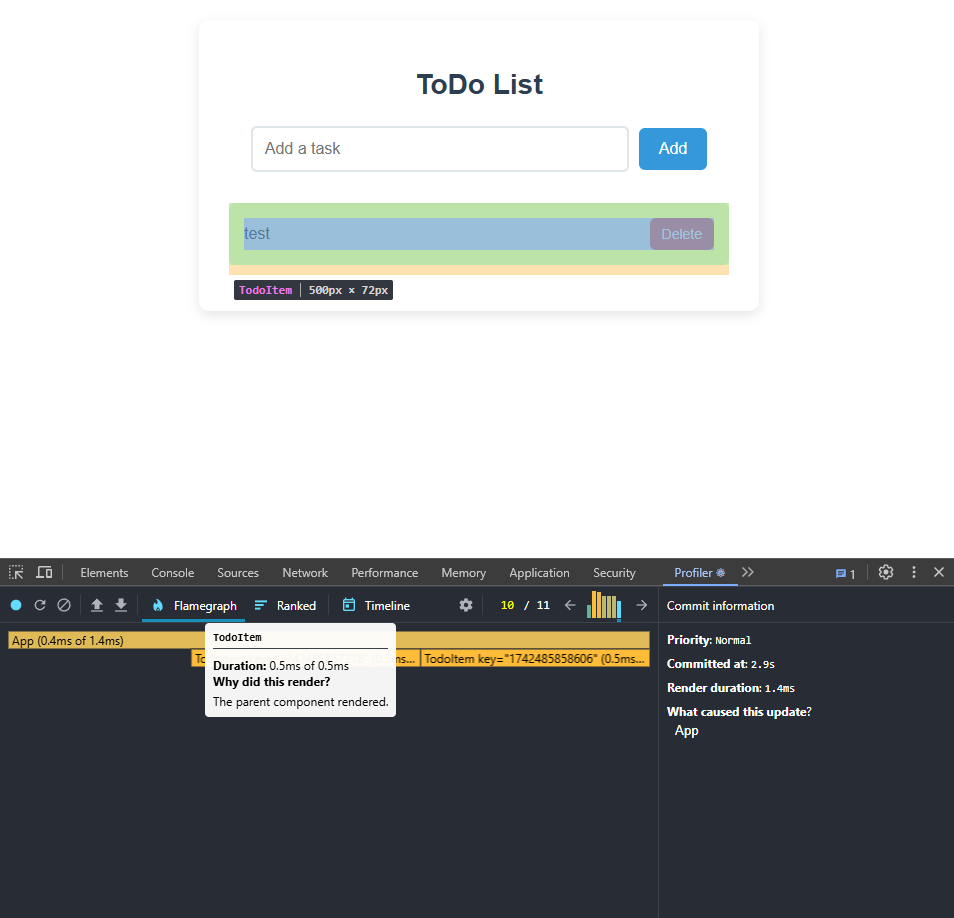 React DevTools profiler showing the “why did this render” hint
Adding React.memo() into the TodoItem component improves the situation even further.
A memoized item turned grey, this means it did not re-render in the given commit:
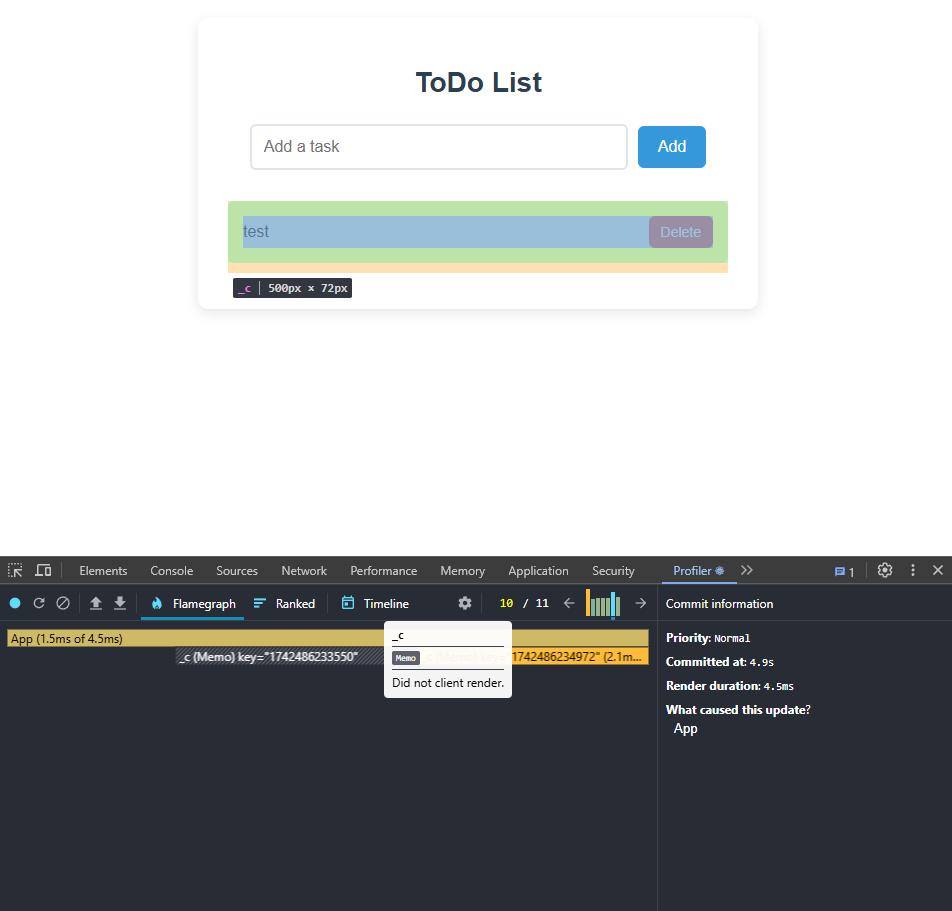 React DevTools Profiler flamegraph with a memoized item
Step 4: Isolating input state
The App component changes its state every time the onChange event is triggered on the input field.
To prevent this from happening, let’s move the input field into a separate component, TodoInput.
// TodoInput.jsx
import React, { useState } from 'react';

function TodoInput({ onAdd }) {
  const [inputValue, setInputValue] = useState('');

  console.log('TodoInput rendered');

  const handleAdd = () => {
    if (inputValue.trim()) {
      onAdd(inputValue);
      setInputValue('');
    }
  };

  return (
    <>
      <input
        type="text"
        value={inputValue}
        onChange={e => {
          setInputValue(e.target.value);
          console.log('Input changed');
        }}
        placeholder="Add a task"
      />
      <button onClick={handleAdd}>Add</button>
    </>
  );
}

export default TodoInput;

// App.jsx
import React, { useState, useCallback } from 'react';
import TodoInput from './TodoInput';
import TodoItem from './TodoItem';
import './App.css';

function App() {
  const [todos, setTodos] = useState([]);

  const addTodo = useCallback(text => {
    setTodos((prev) => [...prev, { text, id: Date.now() }]);
  }, []);

  const deleteTodo = useCallback(id => {
    setTodos((prev) => prev.filter((todo) => todo.id !== id));
  }, []);

  console.log('App rendered');

  return (
    <div className="app">
      <h1>ToDo List</h1>
      <TodoInput onAdd={addTodo} />
      <ul>
        {todos.map(todo => (
          <TodoItem key={todo.id} todo={todo} onDelete={deleteTodo} />
        ))}
      </ul>
    </div>
  );
}

export default App;
Running the test again:
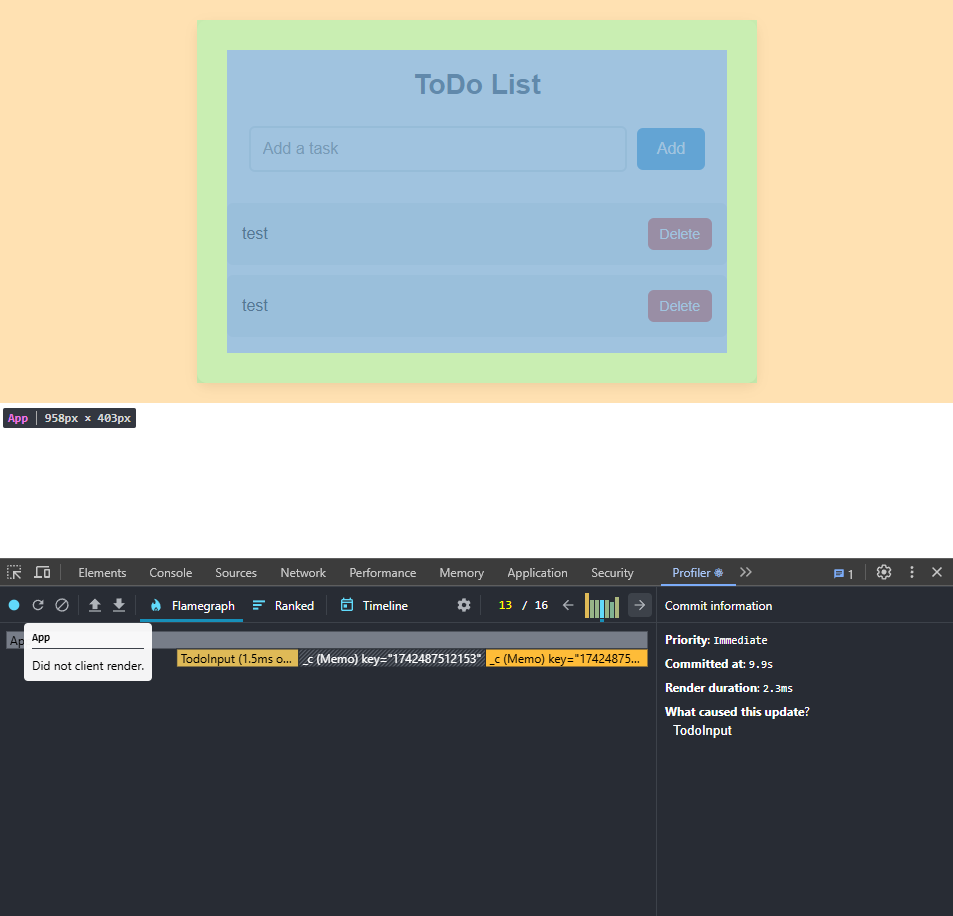 React DevTools Profiler shows separated components rendering independently
The TodoInput component now does all the heavy lifting when the input field changes,
and the App component renders only when the tasks list is updated.
A note on optimizing apps as a whole
The example app given in this article is rather on the simpler side of the web development spectrum. The performance of content-heavy apps usually depends on several factors. While it is possible for a developer to optimize and maintain efficient front-end and back-end performance, getting the network part of the equation under control for all visitors might be tricky.
Uploadcare offers a convenient way to upload, store, transform, optimize, and deliver images, videos, and documents. With the widely-distributed Content Delivery Network, the platform accelerates the loading of the media assets to your visitors. Talking in React terms, if there’s a component that is suspended until some media is loaded, this component would render faster.
Wrapping up
Getting good at React Developer Tools isn’t just about speeding up apps — it’s changing the way we build them, helping us plan ahead instead of just fixing things. With our ToDo app, we saw how simple changes like keeping state separate or reusing functions can make a big difference. For larger apps with lots of images or videos, using something like Uploadcare Image CDN alongside these tricks can make things not only faster, but better for users. It’s about working smarter, not just speeding things up.