What is TTI (Time To Interactive)? What does it say about your website?
Last edited:
The modern web is full of standards, and not only the formal ones that are laid down in HTML and Javascript documentation solely for developers. I’m talking about those unspoken rules and behavioral patterns that have been unconsciously developed by users of the internet themselves. They may have developed organically, but some vital ones have been documented throughout the years. And the more I move down the path of web development, the more I observe the following:
If something behaves differently than it looks, then visitors are frustrated.
This is especially true if it happens when a potential user interacts with your website for the first time. A severe case is when a website appears ready visually but doesn’t respond to user input. How to measure and track this behavior? For that, there’s the Google Lighthouse performance metric, Time To Interactive.
Time To Interactive meaning
TTI’s meaning is pretty straightforward. It is a metric that measures the amount of time it takes for a web page to become fully interactive and responsive to user input after the initial page load. In simpler terms, TTI represents the time difference between the start of a page load and the point where a user can comfortably interact with its elements like buttons, links, forms, and other user interface components. It is one of the key metrics showing your web performance.
What does TTI measure?
Time To Interactive (TTI) is one of the 6 metrics tracked by Google Lighthouse in the Performance section.
Technically, a fully interactive web page with good TTI means:
- The First Contentful Paint (FCP) happened quickly.
This metric is basically telling us when the user is able to see anything on the screen giving them reassurance that something is happening.
In other words, FCP is a timestamp of how long it takes a browser to render an image, text block, or non-white
<canvas>element on the page. - No long Javascript tasks happened within the last 5 seconds. Next, execution of these commands shouldn’t last more than 50 milliseconds.
- No more than two in-flight GET requests happening at the same moment.
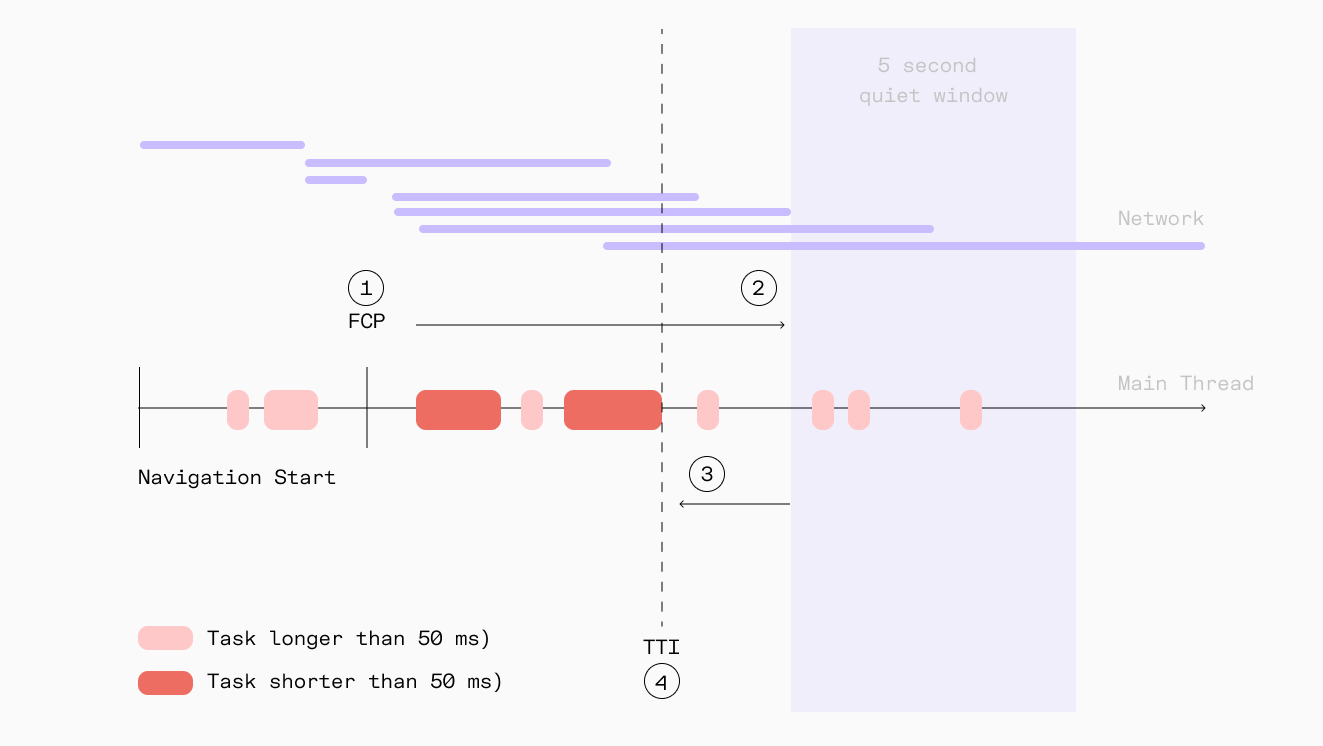 In this diagram, TTI is the end time of the last long task that happened prior to the start of the 5-second quiet window.
Reference values
Lighthouse interprets the TTI score with a simple calculation of time:
- From 0 to 3.8 seconds — Green (fast = good TTI score)
- From 3.9 to 7.3 seconds — Orange (moderate responsiveness)
- More than 7.3 seconds — Red (slow load time)
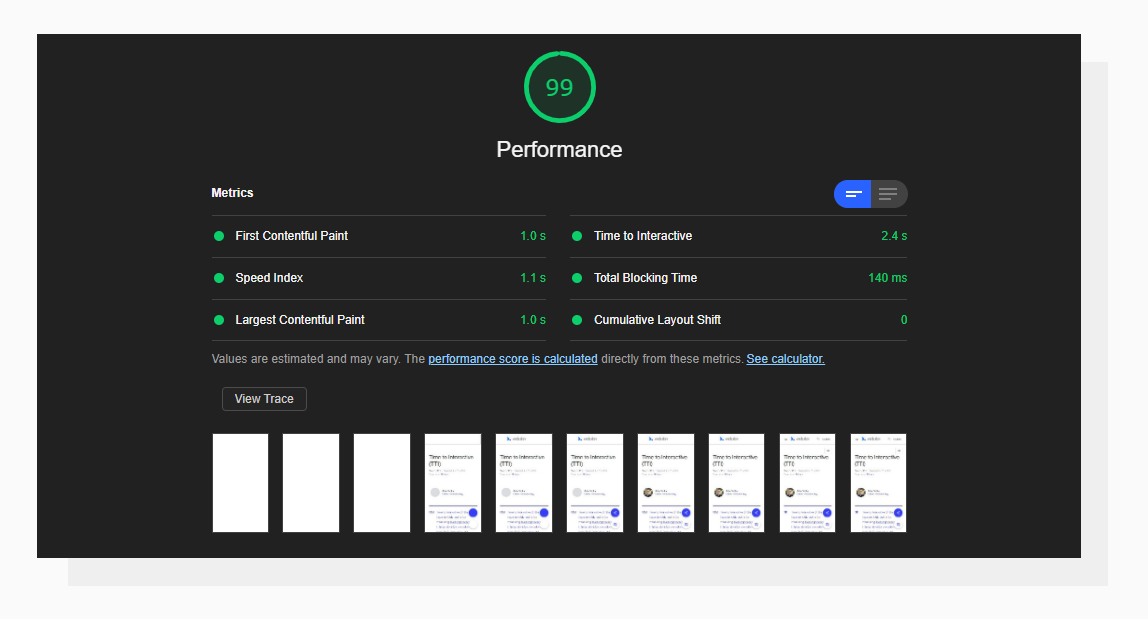 An example of a good Time To Interactive result.
These values are based on the data taken from the HTTP Archive. Basically, Lighthouse compares your results to other websites from the database and assigns a score based on which percentile your website is placed in. This approach is also used for other metrics that are covered in our Google Lighthouse series.
Google Lighthouse vs. Core Web Vitals
If your server response time is above 200 ms you might want to check other performance metrics too. Lighthouse performance scoring happens in a lab-like environment so checking Core Web Vitals that use real-world, anonymous data might be beneficial.
For example, some of the issues happen within the First Input Delay which measures the delay your users might experience when interacting for the first time with your site. It is the time frame of when the browser is actually able to respond to that interaction such as a link or button click. Uploadcare has a separate blog post dedicated to FID.
How does your site score on the TTI metric?
The best way to check TTI for your website is to run the Google Lighthouse performance report.
What causes a slow TTI?
There could be different reasons. Now that you know the definition of TTI, let’s go over the typical bottlenecks.
Enormous network payload size
The First Contentful Paint event is triggered when the first “meaningful” element appears on the page.
No matter what type of element it is, displaying it can be delayed if there are render-blocking resources embedded in the page above the element which downloads large files over the sometimes not-so-good internet connection, for example, a <script> or <link> tag pointing to a stylesheet.
To solve this, I suggest optimizing the source code to make it “lighter” by reducing its file size to a possible extent and also detaching from third-party libraries where possible. With good browser support, you may not need lots of language polyfills like several years ago
Too much JavaScript on the page load
Very often caused by general-purpose plugins or libraries, this happens when a script tries to affect many elements on the page right when the page has been loaded (an overinflated jQuery $(document).ready() is often the culprit here).
Yes, this is a good move to make sure that the page’s DOM is built before starting to manipulate its elements. But instead of going through all of them (say, initializing all the JS sliders on the page), a better practice for optimization would be to affect only the visible ones first. This leads to less simultaneous JavaScript work, and, most likely, fewer long JavaScript tasks.
This process is also referred to as lazy loading.
Many simultaneous network requests
Last but not least, the number of network requests is an important factor to keep in mind. Let’s jump right into an example and talk about images.
Images are not render-blocking. That means that if a browser encounters an <img> tag when parsing an HTML file, it will start loading the image and go on to further tags without waiting for the image to load fully.
This may sound good at first.
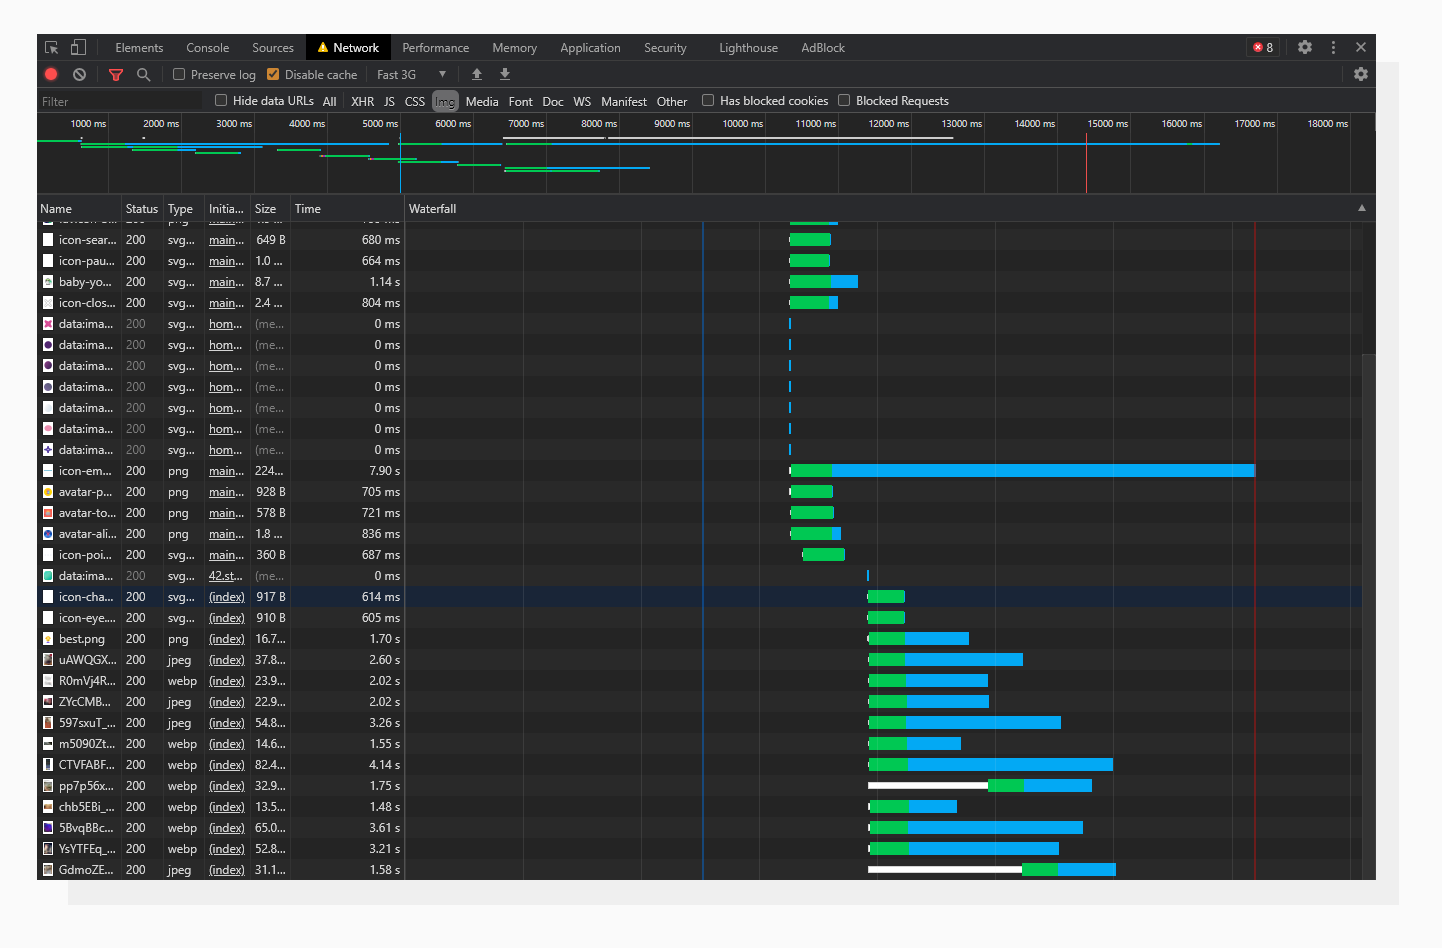 An analysis of an image-rich website. Pay attention to the simultaneous image loading.
On the other hand, it will also make heavy non-optimized images on the page load simultaneously, and this most likely will take much more time to load and keep those request connections open, extending the Time To Interactive.
Keep in mind that in-flight requests to images do not block interaction. You can check this by opening any news website with lots of images — you can interact with the website even though the images are still being loaded.
A solution here would be to utilize the lazy loading technique together with optimizing images on demand. At the end of this article, I will describe how to do this with a practical tool, so stay tuned.
Lazy loading happens when the user scrolls to the point, when the browser “believes” he/she will scroll further to see an image placed somewhere below the above the fold section, and only then the browser fires requests to load images. Leveraging lazy loading for static assets can significantly improve TTI.
Seeking advice: how to improve the TTI metric?
A general rule of thumb would be to follow the advice given in the previous section. The exact areas to look at can be found in your website’s Lighthouse report. Here’s where to look regarding Javascript:
Minimize main-thread work
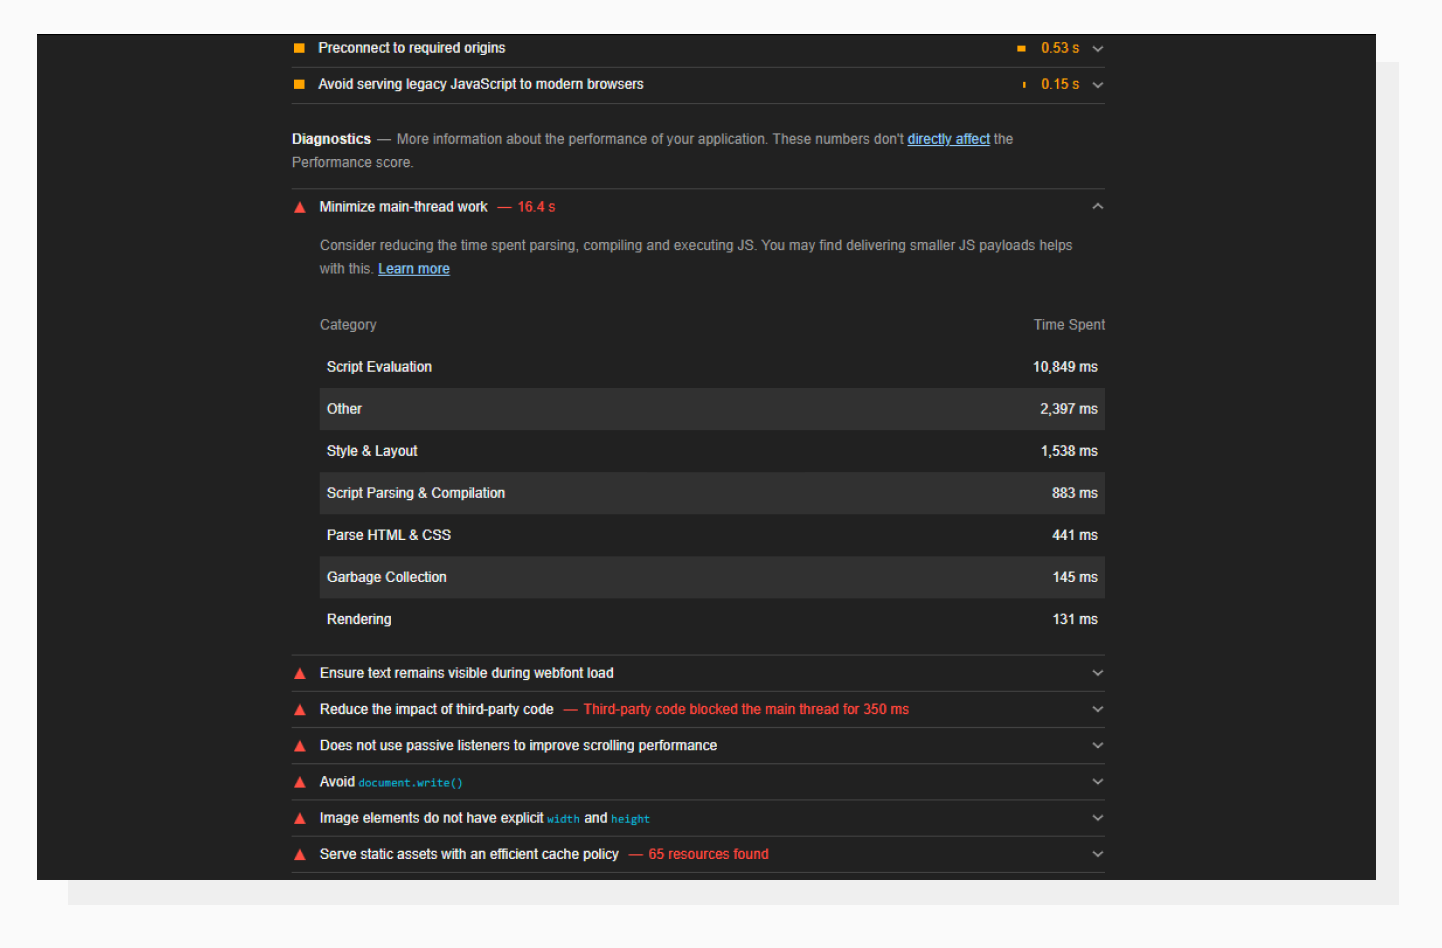 A high “Script Evaluation” is usually a reason for poor TTI.
Basically, this means that all the JavaScript that runs in the main thread (and locks up the browser) makes a page unresponsive. The devil is in the details here. This accordion tab gives you a rough description of the direction you should be moving in. To find out what tasks take a long time to complete, let’s go to the Performance DevTools tab and run the profiler.
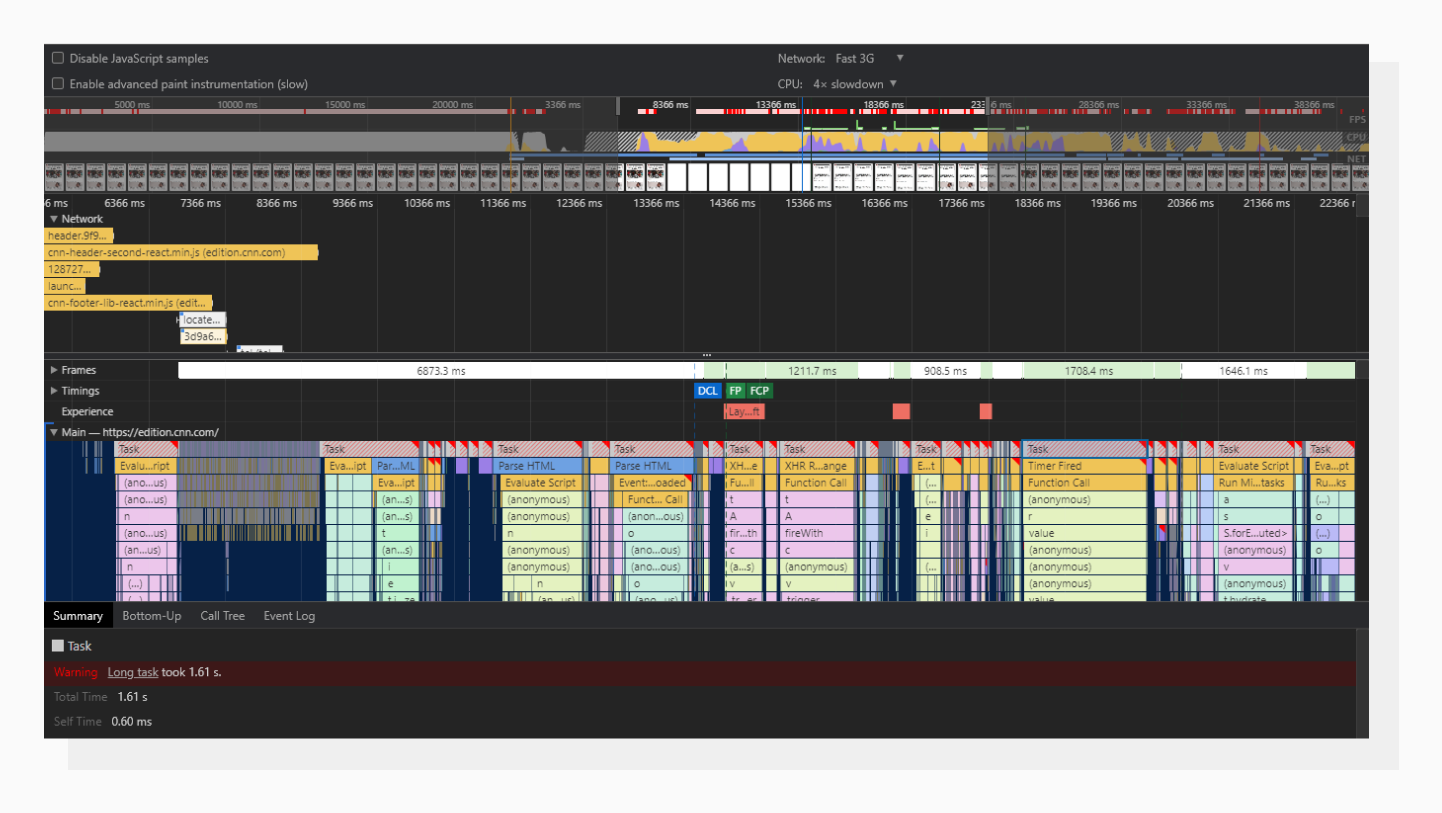 A visual representation of the page loading process.
Those gray rectangles with the diagonal red lines are long tasks. A task itself may consist of several function calls, which are placed beneath one another in chronological order. Using this tab, you can go to the roots and search for the problem there.
On one of my projects, I had a problem with the WordPress Ninja Forms plugin: it was causing these long tasks. Some forms were hidden in modal windows but still initialized on page load. Applying lazy loading to those forms drastically improved the overall performance score.
Reduce JavaScript execution time
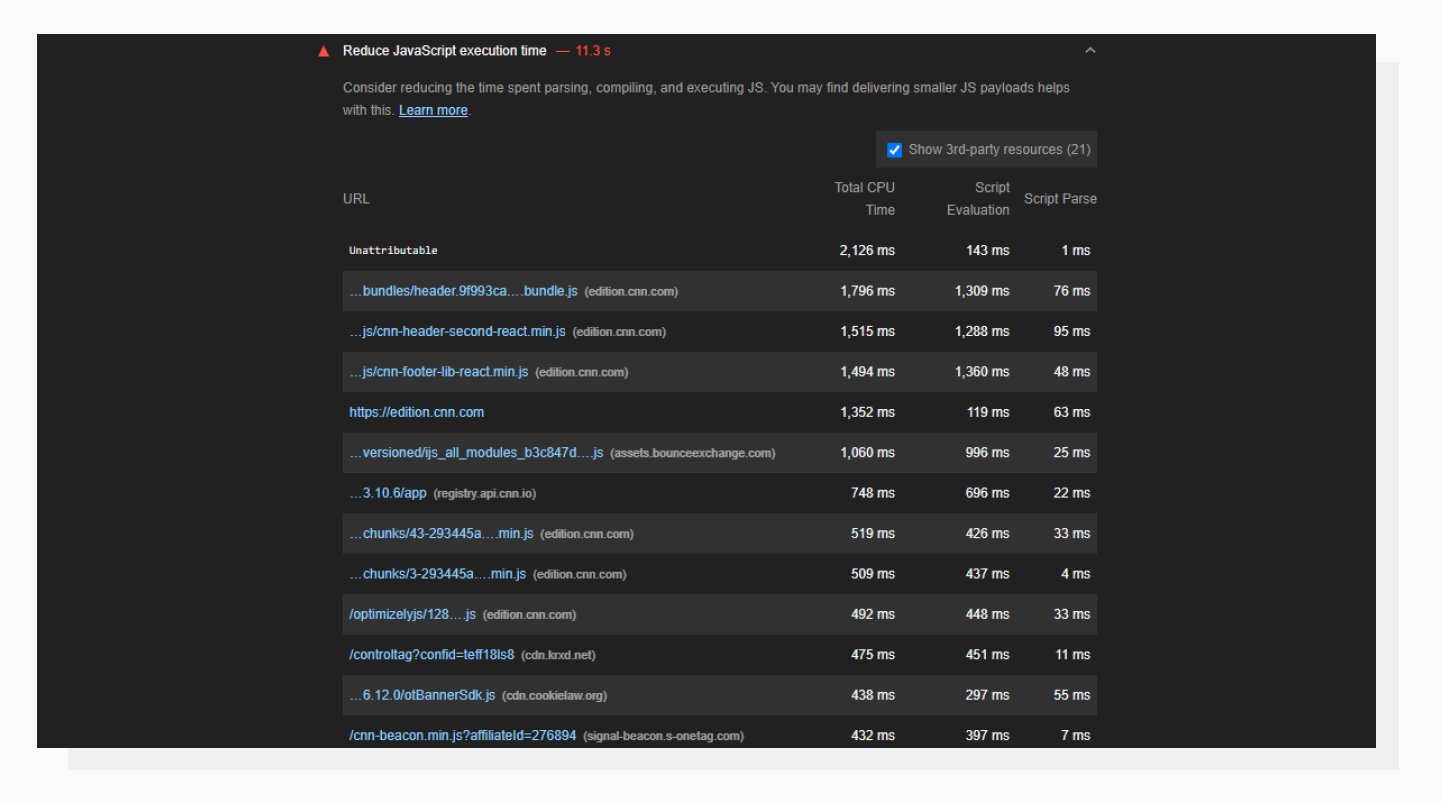 Here you can find what scripts are causing issues.
This info looks similar to what was provided in the Performance tab. URLs are sorted using the Total CPU Time parameter, which demonstrates how resource-hungry a particular script is. This is also a useful tab to investigate third-party scripts, especially analytics and ad-related ones; they tend to put down roots quite rapidly.
To the rescue: lazy loading optimized images for better TTI
You can get the most out of the advice from the previous section if there are no network or payload-related problems on the website. At this point, let me get back to the practical tool I mentioned earlier.
There’s a tool by Uploadcare called Adaptive Delivery. It allows you to:
- Enable auto lazy loading for images
- Optimize images: Change dimensions, size, and quality based on the visitor device’s capabilities (AI-aided)
- Apply image transformations on the fly
In a nutshell, it’s a little script that will take care of all the heavy front-end lifting when it comes to images. There’s no need to build and manually compress different versions of the same image for all different devices.
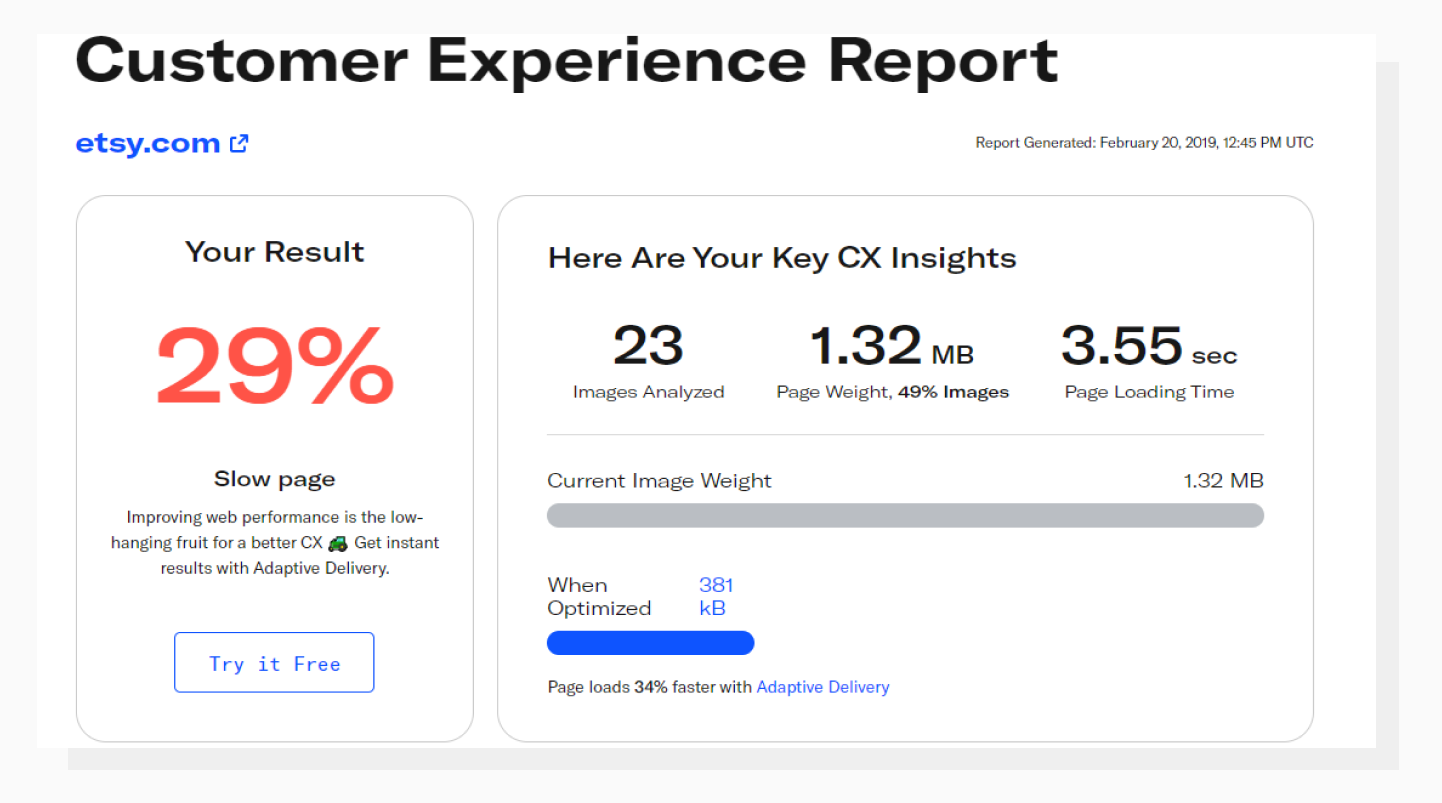 PageDetox tells you how fast your website can be if you use Adaptive Delivery.
To check whether this solution fits your needs, try running a performance audit against your website with another Uploadcare tool: PageDetox. It will give you info about how much bandwidth can be saved in your particular case by optimizing images. Optimized network payload size leads to significant improvements in website performance scores.
Another step you can take is to use Content Delivery Network. Implementing a Content Delivery Network (CDN) can significantly enhance web performance metrics and contribute to improving Time To Interactive (TTI). By allocating static content across multiple servers kept in different geographic regions, a CDN reduces the distance data needs to travel, shortens the latency for your users and accelerates resource retrieval.
In conclusion
Improving a website’s performance score is usually a matter of taking a systematic approach to identifying problems and fixing them. When doing so, I’d recommend thinking of the people who will visit your website and the good user experience first, rather than just the raw numbers.
Anyway, taking care of user interaction times can influence your website speed and the biggest improvement always starts from a single spark. Apart from the Lighthouse performance score, I highly recommend checking your page against the Google PageSpeed Insights report as it allows you to find out more about your user experience.
Good luck on your way towards a high-performing website!