What is Total Blocking Time (TBT) and why it matters
Last edited:
Before writing this post, I was thinking about the fact that we still use the term “web page.” Ideally it refers to a static layout of content, say, text and images like in a book, and that was the case back when the internet started.
But the state of the art in web development dictates its own rules, turning websites into full-featured applications. With scripting you can enhance your website with effects, modals, data processing, etc. While that may sound like an endless field of opportunities, overdoing it may cause a website to feel sluggish or even become irresponsible to user input.
What is Total Blocking Time?
Total Blocking Time (TBT) is a lab metric that measures the load responsiveness of a page. Higher TBT values usually indicate that the website reacts to a user input not as quickly as it should to make the user experience smooth.
TBT does this by measuring the total amount of time between First Contentful Paint and Time To Interactive and finding long tasks within the aforementioned timespan.
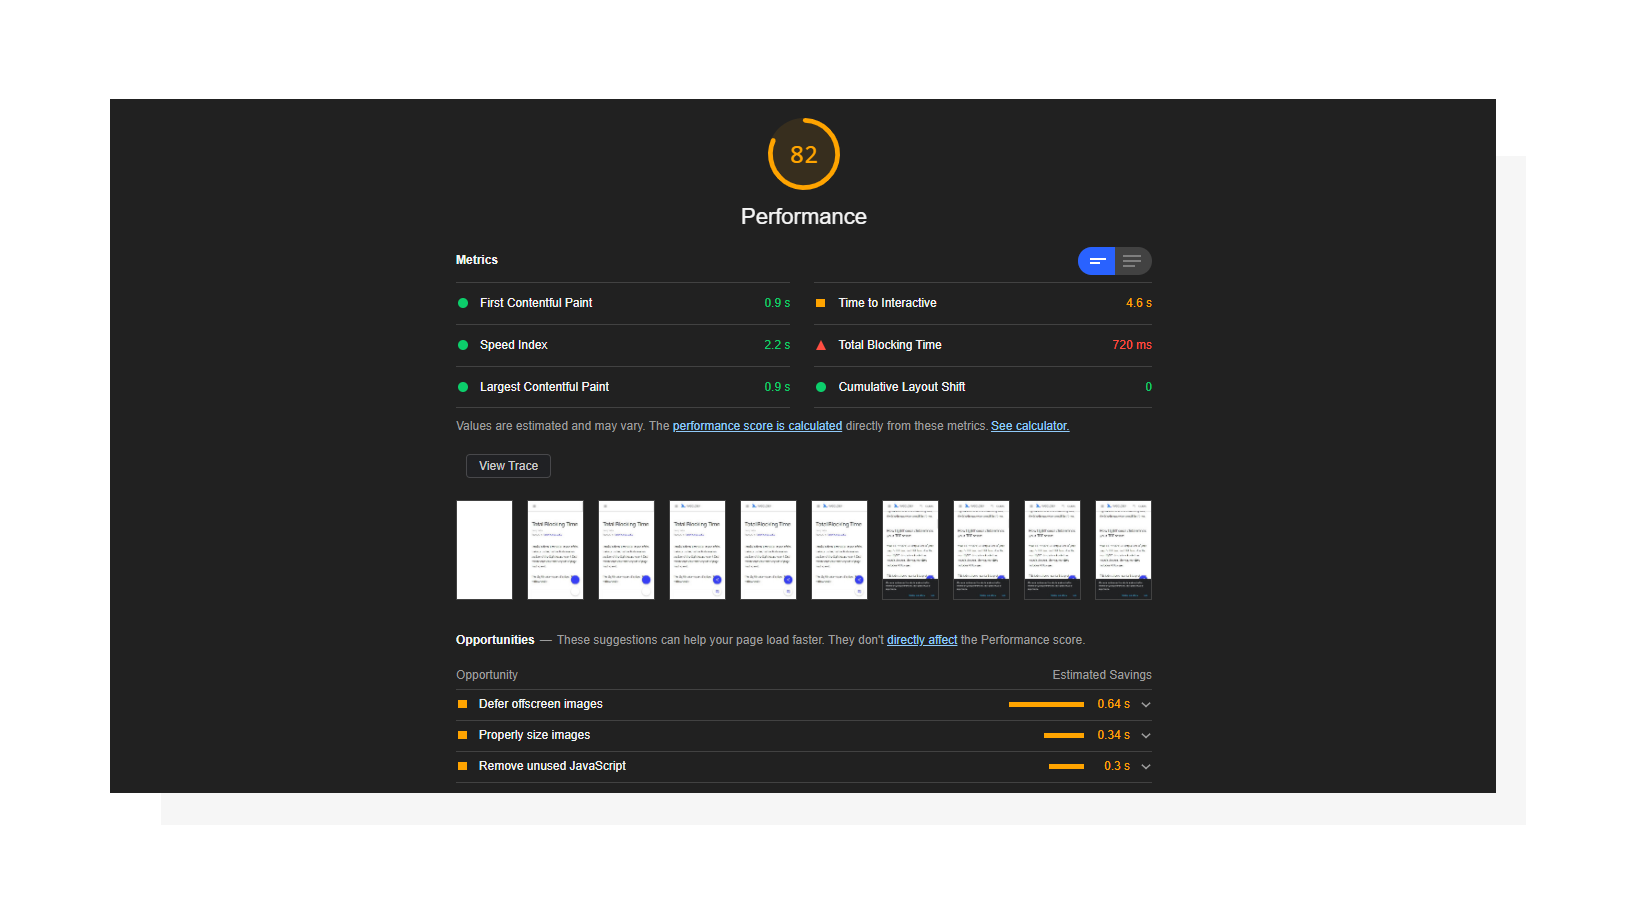 Lighthouse performance report including Total Blocking Time.
To determine TBT, Lighthouse compares your results to the top 10,000 websites loaded on mobile devices. Here’s the distribution:
- 0 - 300 ms — Green, fast
- 300 - 600 ms — Orange, moderate
- More than 600 ms — Red, slow
It’s worth mentioning that Total Blocking Time has a 25% impact on the overall score on mobile devices, making it an important metric to improve. You can see it yourself when changing values in the Lighthouse Scoring Calculator.
What is a long task?
To deliver an interactive page, the browser interprets a response from the server in a progressive manner. It loads and parses HTML code, fetches CSS and JavaScript, and then evaluates scripts. All of these may block the browser's main thread — where a browser processes user events and then paints what’s been updated — making the page unresponsive to user input.
A JavaScript task that keeps the main thread busy for more than 50 milliseconds is considered a long task.
However, the “blocking” time of the task is everything that is above the 50-millisecond threshold. Therefore, the sum of the blocking time for each long task between FCP and TTI is the Total Blocking Time.
Let’s consider the following timeline as an example:
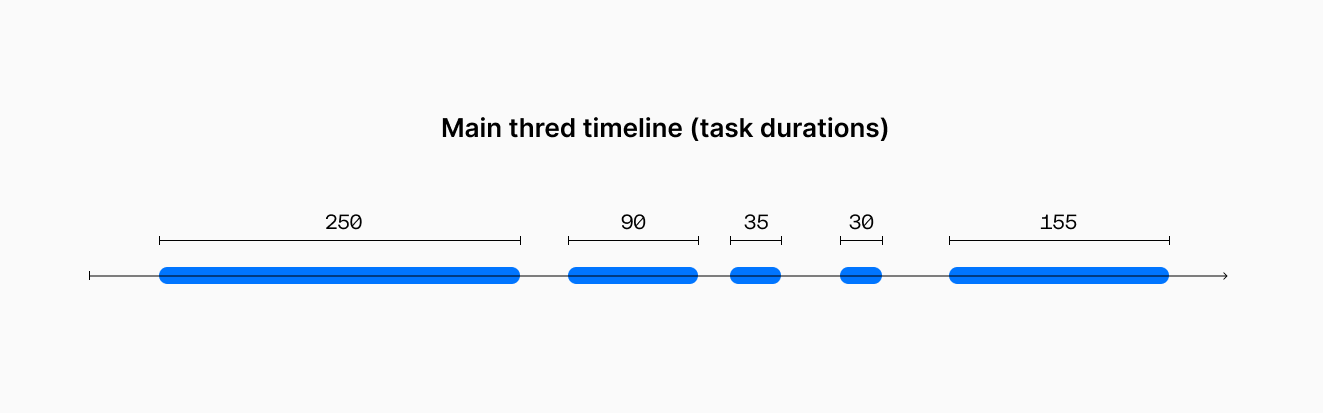 Durations of tasks in the main thread.
While there are 5 tasks in the example above, only 3 of them are long tasks. So, to calculate the blocking time, the browser will take overheads of each of them and combine into the total value, like on the picture below:
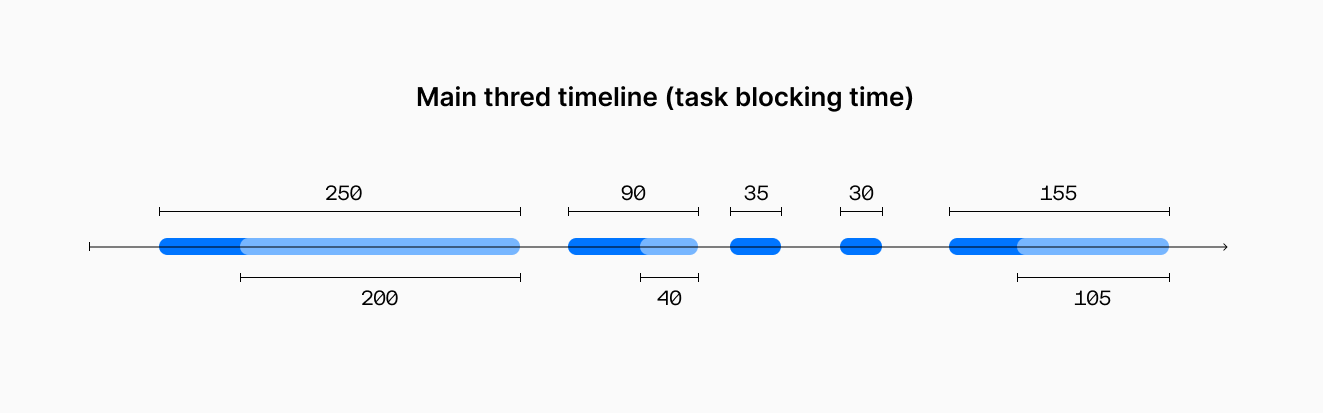 The light blue parts are considered blocking here.
Summing up everything, we see that it took the browser 560 milliseconds to process everything, and only 345 milliseconds of that time is considered blocking time.
The math behind TBT
According to Google and the RAIL performance model, we should respond to a user input within 100 milliseconds so as not to break the perceived connection between user action and website response. But why is our limit only 50 ms then?
There could be other work being done in addition to the current input handling. For example, there could be a task, but not a long one, running when the input happens. This means that we should take into account an additional potential 50 milliseconds (occupied by a previous task), hence only 50 milliseconds left for the script to respond to the user input.
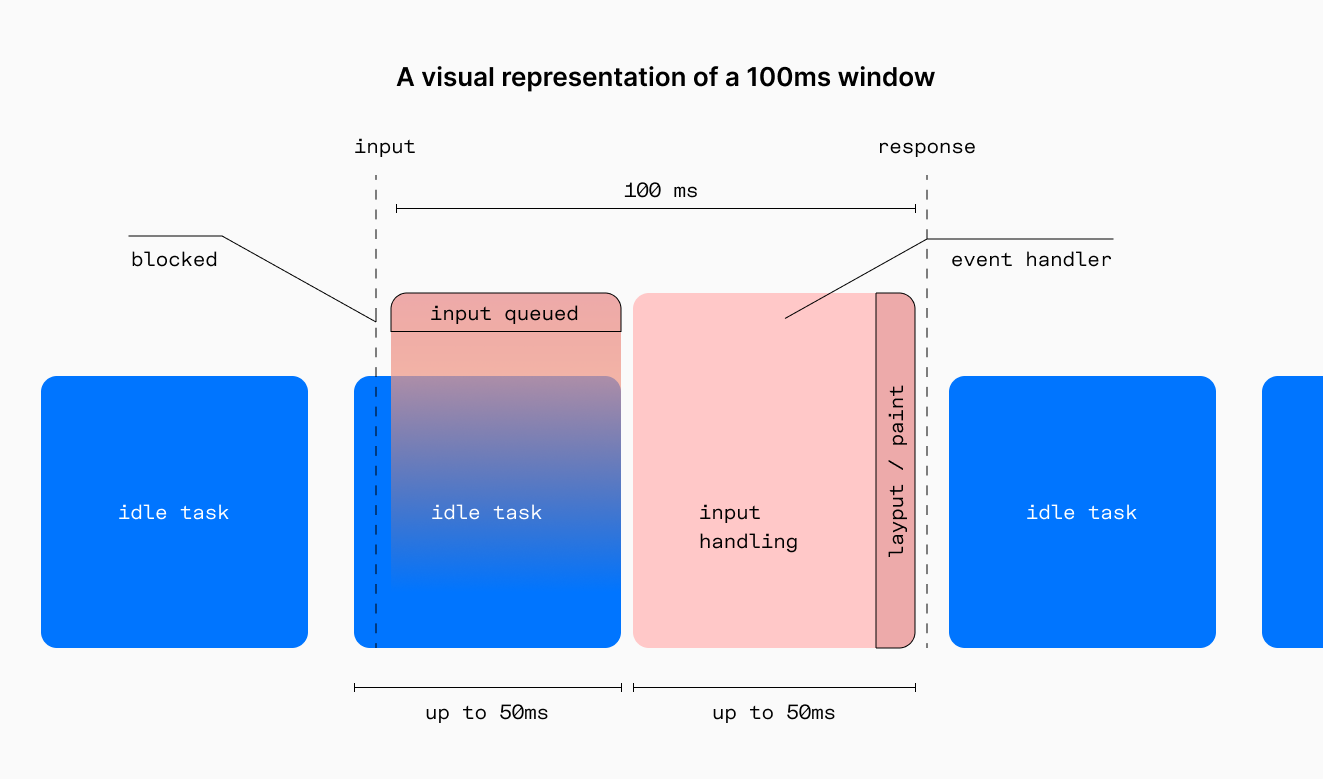 A visual representation of a 100ms window.
Example: finding long tasks on the page
When it comes to fixing something, the first step is to identify the source. This is where you can utilize the Performance tab in Chrome WebTools. Go to the tab, set Network to Fast 3G and select 4x slowdown in CPU to emulate an average mobile device and start recording. Let’s look at an example result:
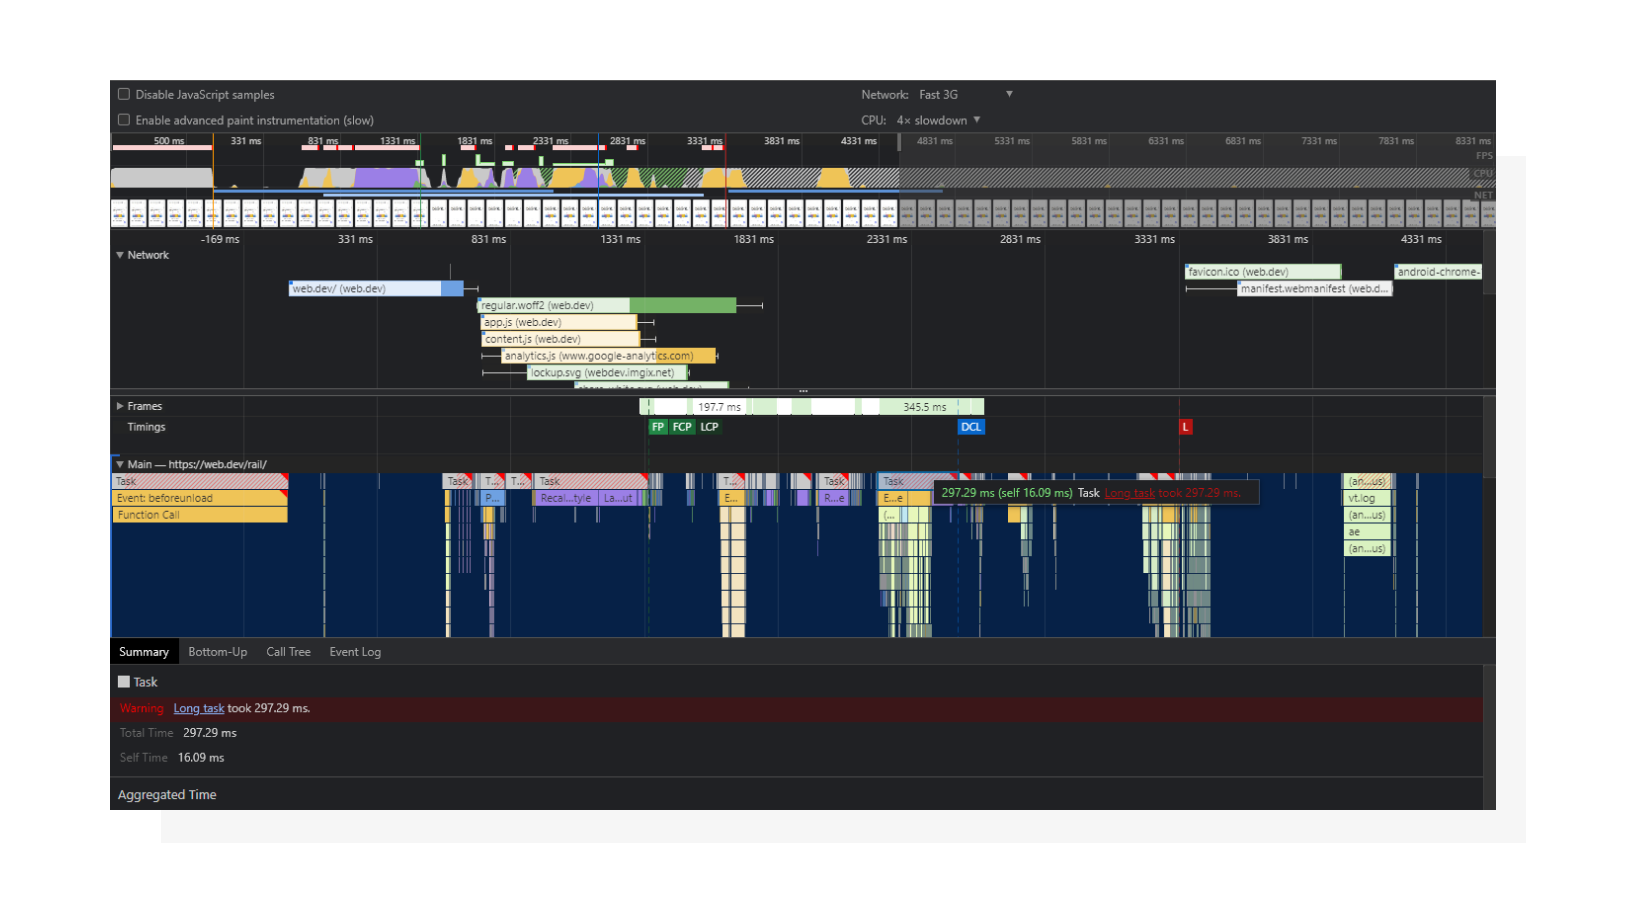 A visual representation of a page loading process. We will be looking at the tasks.
Tasks (shown in grey) are long tasks if they have red flags. Under each task you can see a stack-like list of functions that call each other (from top to bottom). Click on them to find detailed info about the pieces of code that are causing issues. When talking solely about TBT, you can disregard long tasks that happen prior to the FCP event here, since TBT is measured starting from First Contentful Paint.
Speaking of FCP, I once found this confusing during my career. The intermediate goal was to improve First Contentful Paint. Once that had been done and FCP became green, TBT immediately raised into the red zone. That happened because all the tasks that were happening before FCP were now influencing Total Blocking Time. I always advocate for a complex approach when it comes to optimizing websites, and this was a real-life example of that.
Now that we know how to identify long tasks, let’s talk about fixing them.
How to improve Total Blocking Time
While situations may (and most probably will) vary from website to website, you can use these Lighthouse performance opportunities as a starting point for your diagnostics:
- Reduce the impact of third-party code
- Reduce JavaScript execution time
- Minimize main-thread work
- Keep request counts low and transfer sizes small
Reduce the impact of third-party code
If you’ve ever integrated any third-party services with your website, you may know that it is necessary to inject the vendor’s JavaScript code into the page in order to make it work. However, due to the universal nature of those scripts, they’re not always optimized as efficiently as they could be.
Find detailed info on what external scripts are slowing down your page in this section.
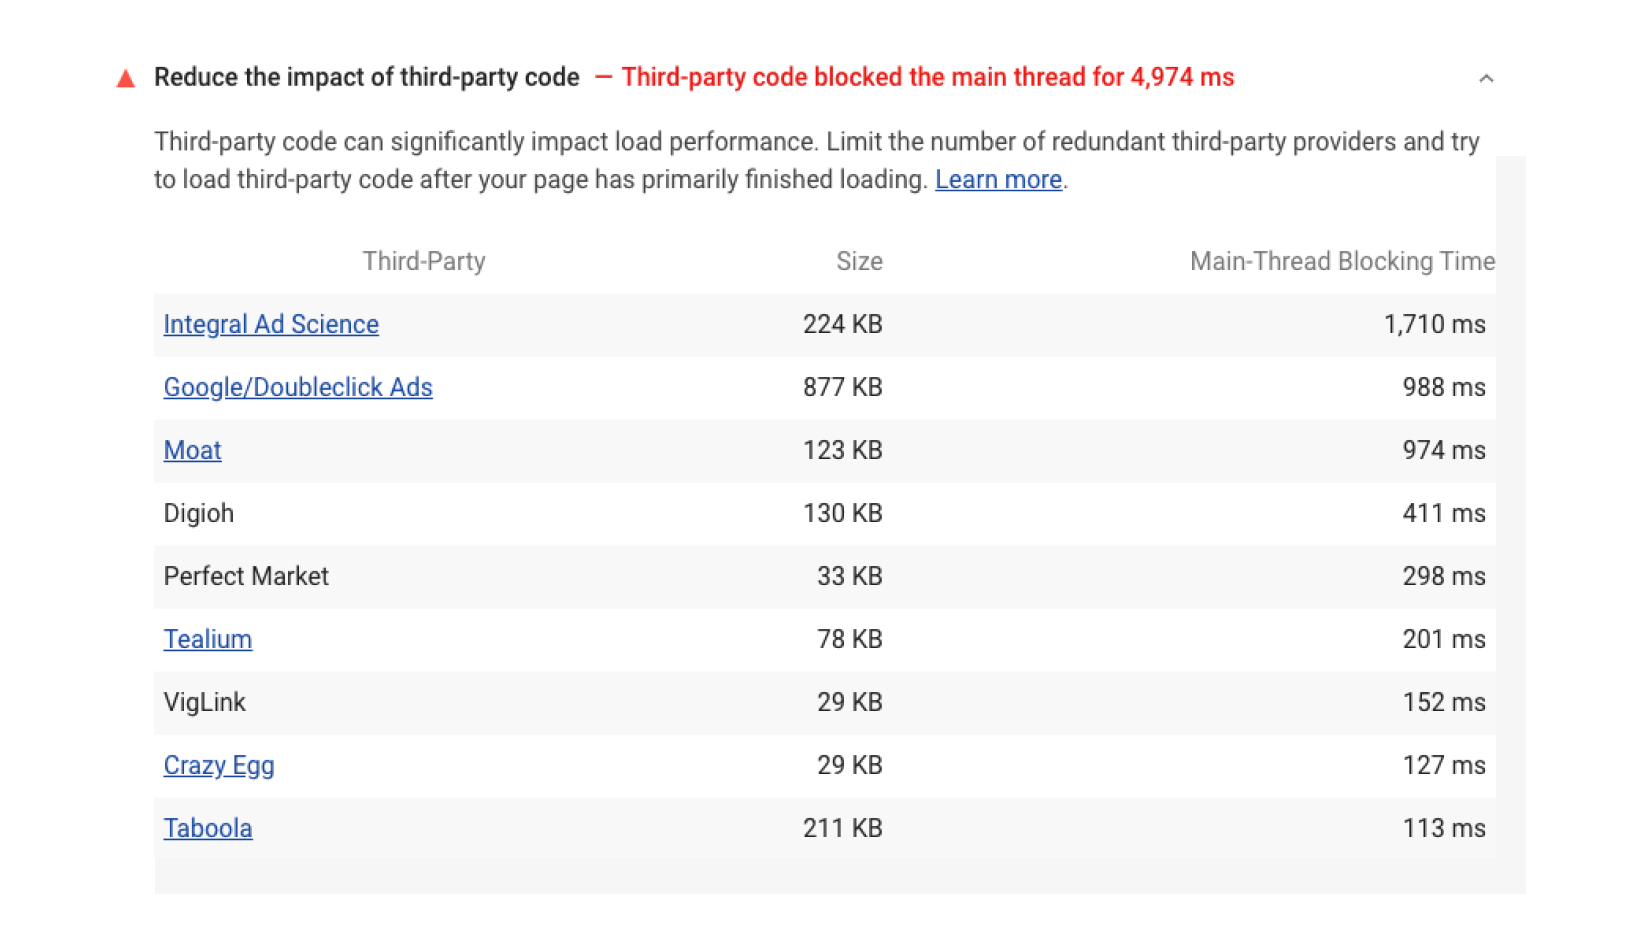 Network and Script Evaluation aspects of third-party code.
Reduce JavaScript execution time
When it comes to scripting, we also need to consider related processes that add up to execution time. These are:
- Network. If an asset (a script in this case) is optimized but served in an inefficient way, it may affect execution time. For example, a good choice would be using a CDN for JS libraries instead of hosting them on your own (for example, jQuery for legacy websites).
- Parsing and compilation. The more code you have, the more prep work a browser will need to do. Consider splitting code into smaller logical chunks and defer actions that are not needed right away.
- Execution. Even a small script may take a long time to finish if it’s not optimized enough.
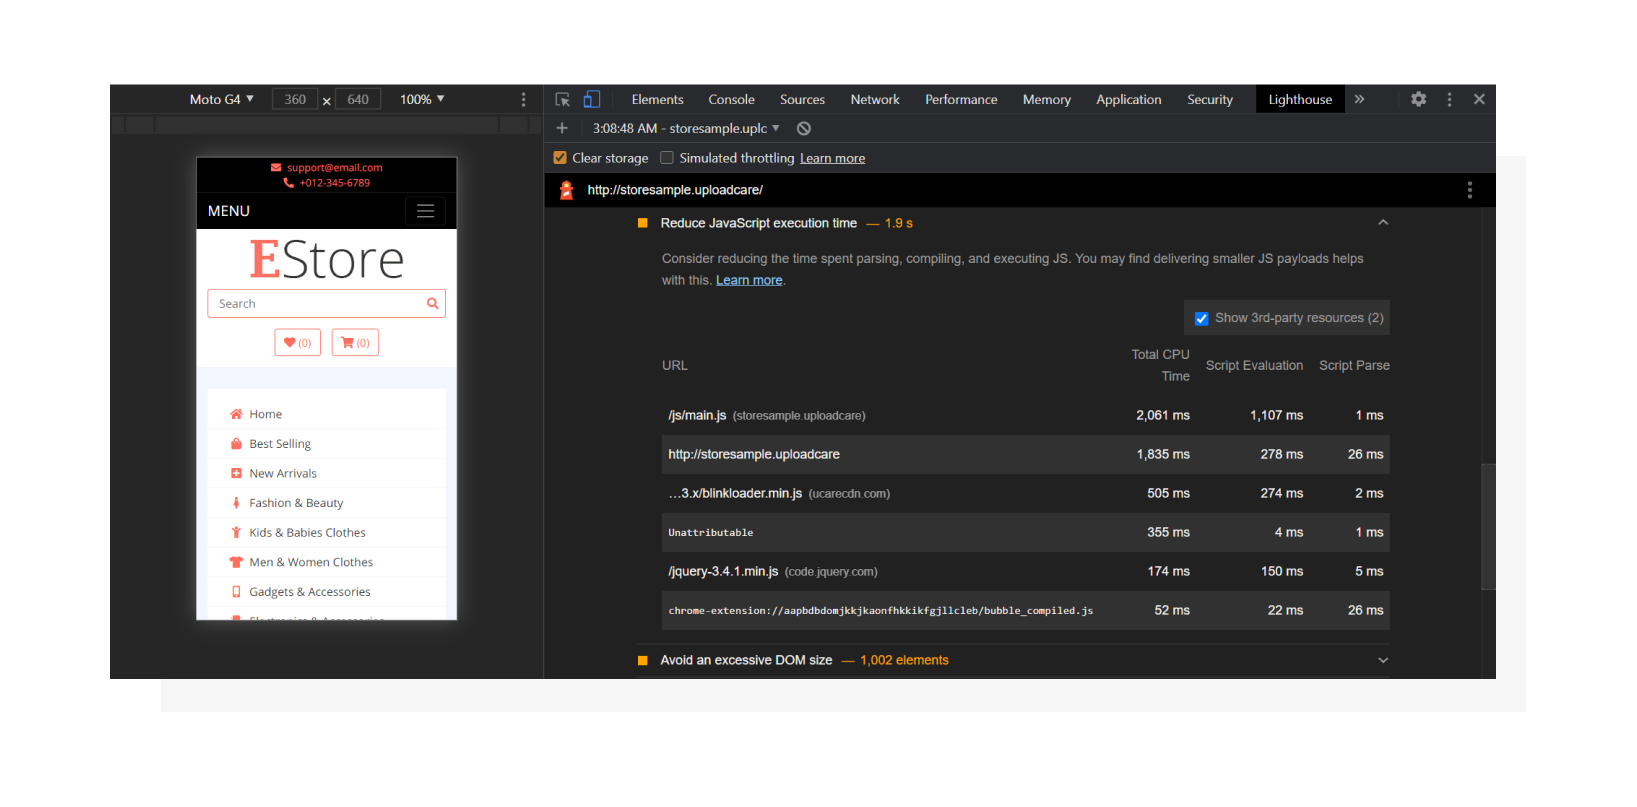 A detailed breakdown of how long it takes a browser to process each script.
All of this affects the time it takes for a script to give control back to the page to respond to user input. This one is closely related to the previous section.
Minimize main-thread work
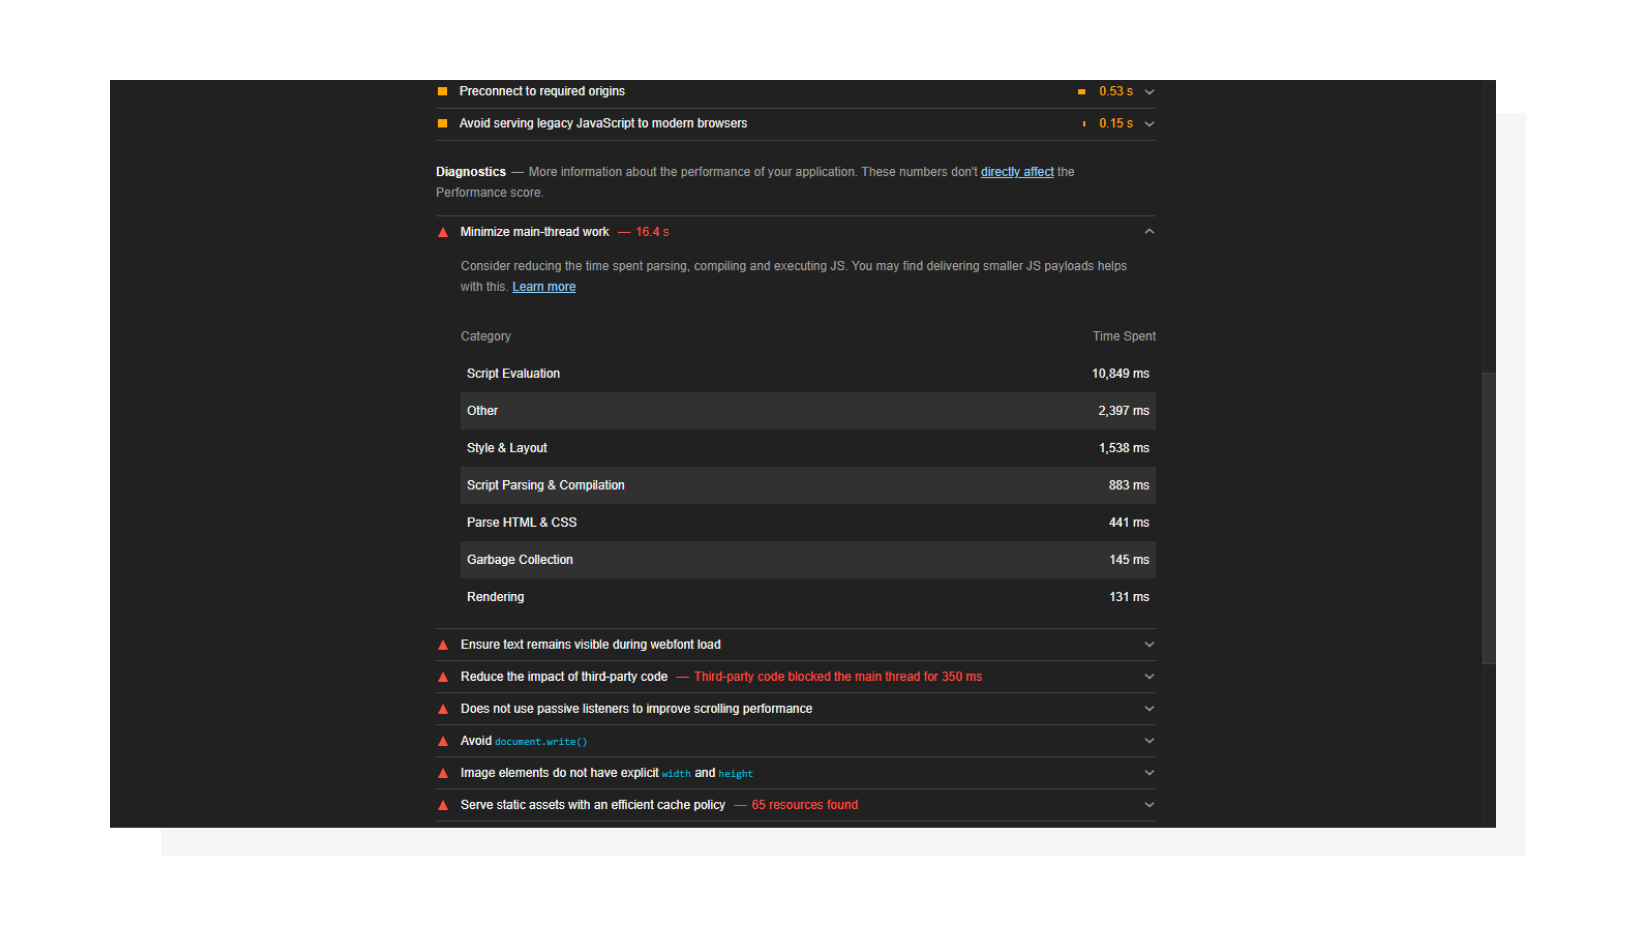 Here you can see that “Script Evaluation” can be greatly improved.
This tab gives you info about what keeps the main thread busy. Use this as a guideline on what direction you should be moving in. If “Script Evaluation” is suspiciously high (like in the screenshot above), I recommend going to the Performance tab in DevTools and running the profiler.
Real-life example: I once had a WordPress website that suffered from large TBT values. After looking at this tab and at the Performance tab, I found out that the forms plugin’s rendering process on the website was JavaScript-driven, and most of that JS was executed on the page load even if the forms were hidden in modals. Implementing lazy loading and dynamic script injection helped dramatically.
Keep request counts low and transfer sizes small
Here you can find out how many requests are made in order to load the page and how much data they consume.
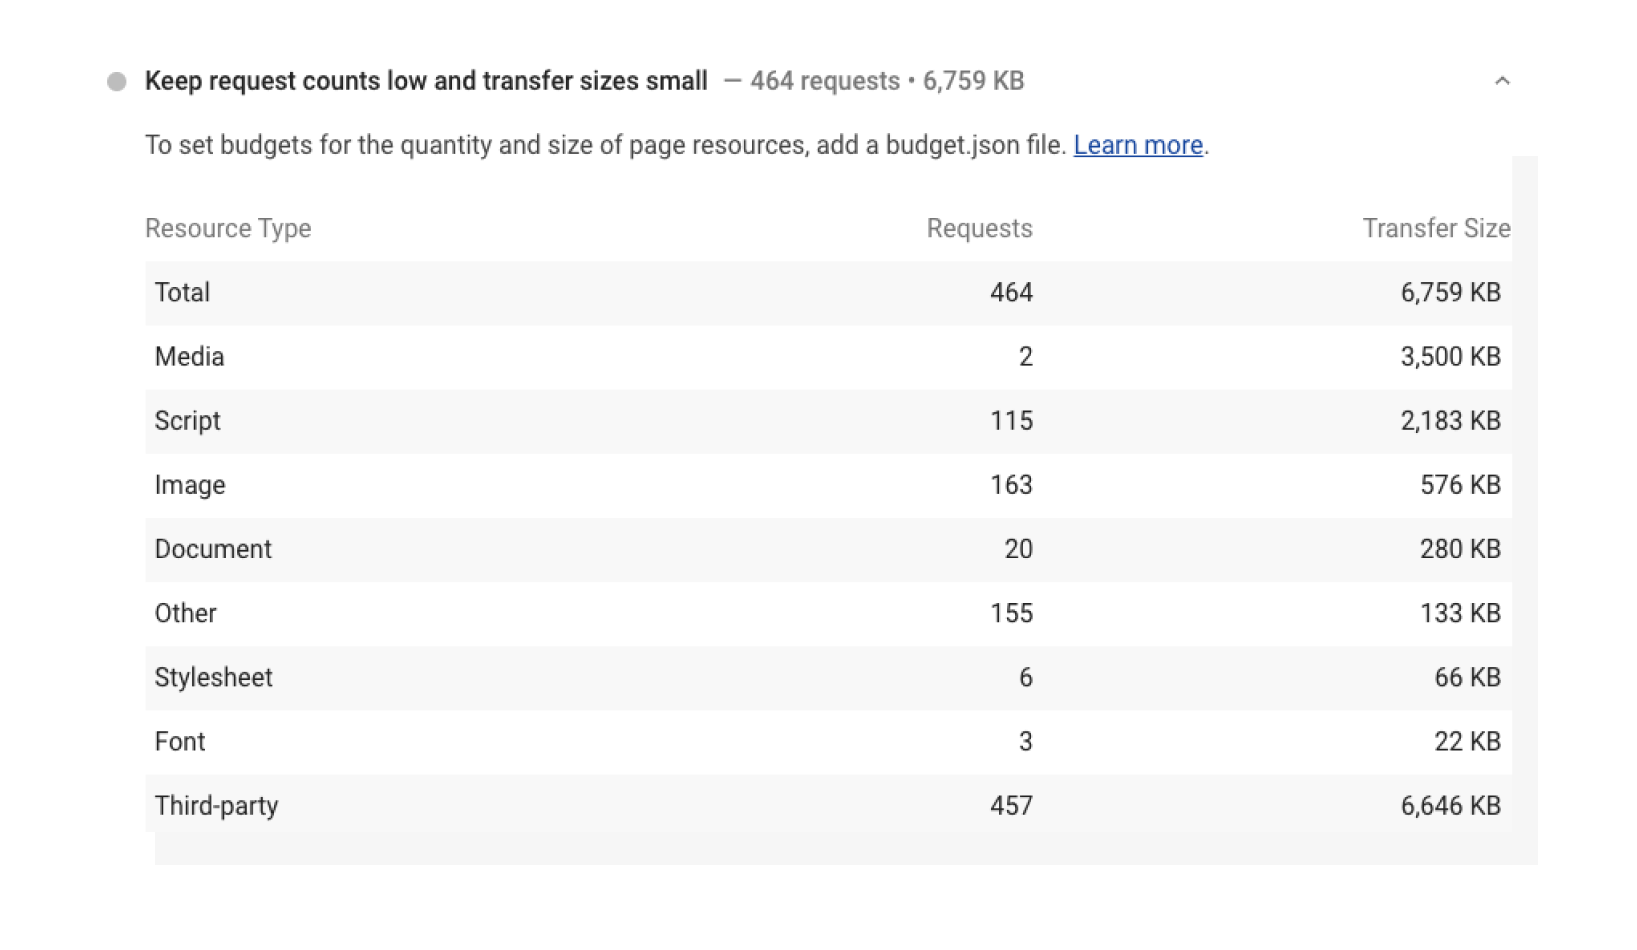 A detailed breakdown of resources that are requested by the page.
If your scripts are render-blocking, your website’s responsiveness may heavily depend on visitors’ network conditions. That’s why it’s important to defer secondary scripts and load them on demand instead of pulling everything at once. It’s not possible to do this in 100% of cases but it’s better to keep in mind when designing your code architecture.
Optimizing images
Take a closer look at the latest example. Besides scripts, there are different kinds of resources, including images. The example above is not severe, but there are many websites out there with heavy and non-optimized images.
Why am I mentioning this if so far we’ve been mostly talking code? Here’s the reason: images load in a non-blocking manner. That means they won’t block the main thread itself, but they may reserve bandwidth and affect the speed of loading script assets, which have a much greater impact on TBT. That’s why I’d recommend taking care of images as well, keeping them optimized and delivered effectively.
To accomplish this in a convenient automated way, Uploadcare created a tool called Adaptive Delivery. It allows you to:
- Defer image loading (aka “lazy loading”). Images load automatically once they enter the viewport.
- Apply image transformations.
- Optimize parameters like size, format, quality and dimensions automatically based on the user’s device configuration.
With the last one, you won’t need to manually prepare different image versions. The tool is content-aware and AI-driven, so the optimal quality will be determined based on the image content.
Also, it’s a tiny (3.7 KB) compressed script, which may save you sometimes megabytes of image data and do all the heavy lifting on the front end.
If you want to look at the potential results Adaptive Delivery can provide in your particular case, test your website with PageDetox, another service from Uploadcare that can generate reports based on image size data.
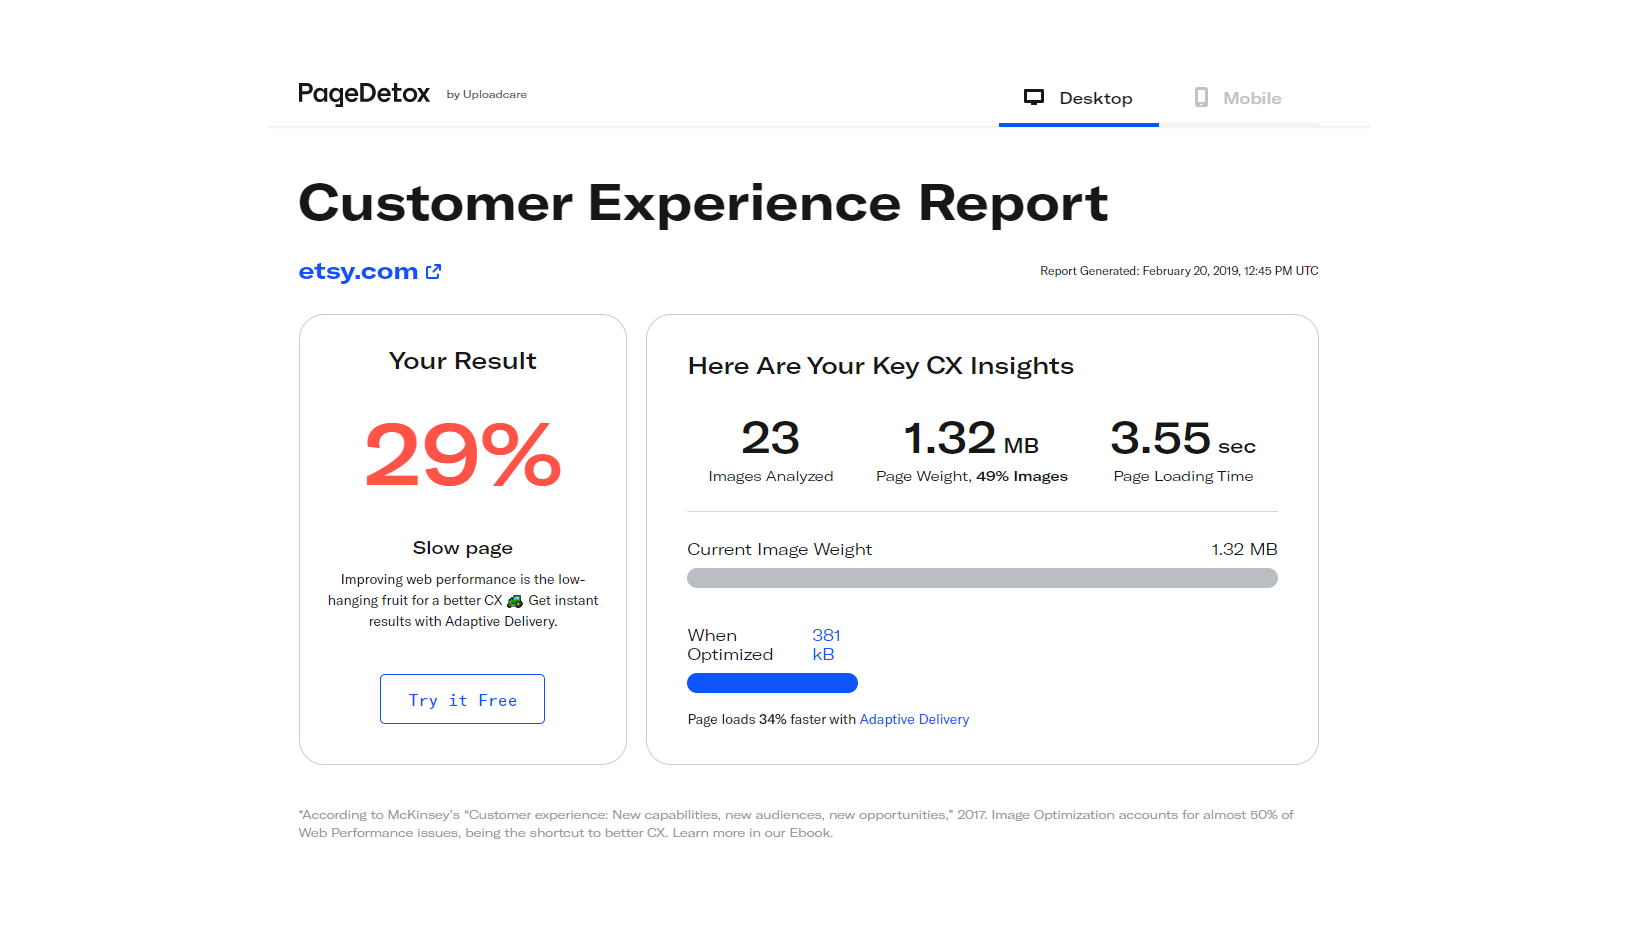 PageDetox tells you how fast your website can be if you use Adaptive Delivery.
Conclusion
It’s important to be realistic about improving website performance and not to take it as a pure numbers game. Usually, Lighthouse metrics are connected to each other and to field metrics as well (like FID is connected to TBT).
To keep your website healthy, I’d first recommend being constantly aware of its performance, wisely choosing new plugins, libraries and services, and monitoring how they affect scores. While there are situations where tweaking a couple lines of code may solve a problem quickly, a systematic and user-centric approach is a more universal strategy of maintaining good scores in the long run.