What is Lighthouse Speed Index and why should you care?
Last edited:
Speed Index is probably one of the most meaningful user-centric metrics when it comes to analyzing a Lighthouse report. It measures how quickly content is visually displayed. Speed Index used to be unitless, but since circa Lighthouse 3, the metric has been measured in seconds.
How is Speed Index measured?
While metrics like First Contentful Paint measure a single point in time, the purpose of Speed Index is to capture the entire loading process of the visible part of a webpage. In fact, Lighthouse takes a video of the loading process in the background and then calculates the difference between frames.
Generally speaking, Speed Index displays the average time it takes for a page to go from its initial state (blank screen) to a visually complete state. The page can continue loading components and processing data in the background, but if it doesn’t change anything the user sees in the viewport, Speed Index won’t be affected. That’s why this metric is user-centric: it only tracks visual progression, the same way a user will perceive the loading speed.
Speed index score benchmarks
To give a score to your particular Speed Index (SI) measurement, Lighthouse compares the result to other real website results taken from HTTP Archive.
For mobile devices, Lighthouse uses the following benchmarks:
| Speed Index (in seconds) | Color-coding | SI Score |
|---|---|---|
| 0–3.4 | Green (fast) | 75 to 100 |
| 3.4–5.8 | Orange (moderate) | 50 to 74 |
| More than 5.8 | Red (slow) | 0 to 49 |
And for desktop devices, the benchmarks are slightly different:
| Speed Index(in seconds) | Color-coding | SI score |
|---|---|---|
| 0–1.3 | Green (fast) | 75 to 100 |
| 1.3–2.3 | Orange (moderate) | 50 to 74 |
| More than 2.3 | Red (slow) | 0 to 49 |
In the previous version of Lighthouse (v5 and v7) the metric’s weight was 15%. In Lighthouse 10, 11 and 12, Speed Index only affects 10% of the total result. You can play around with values in the interactive Lighthouse Scoring calculator.
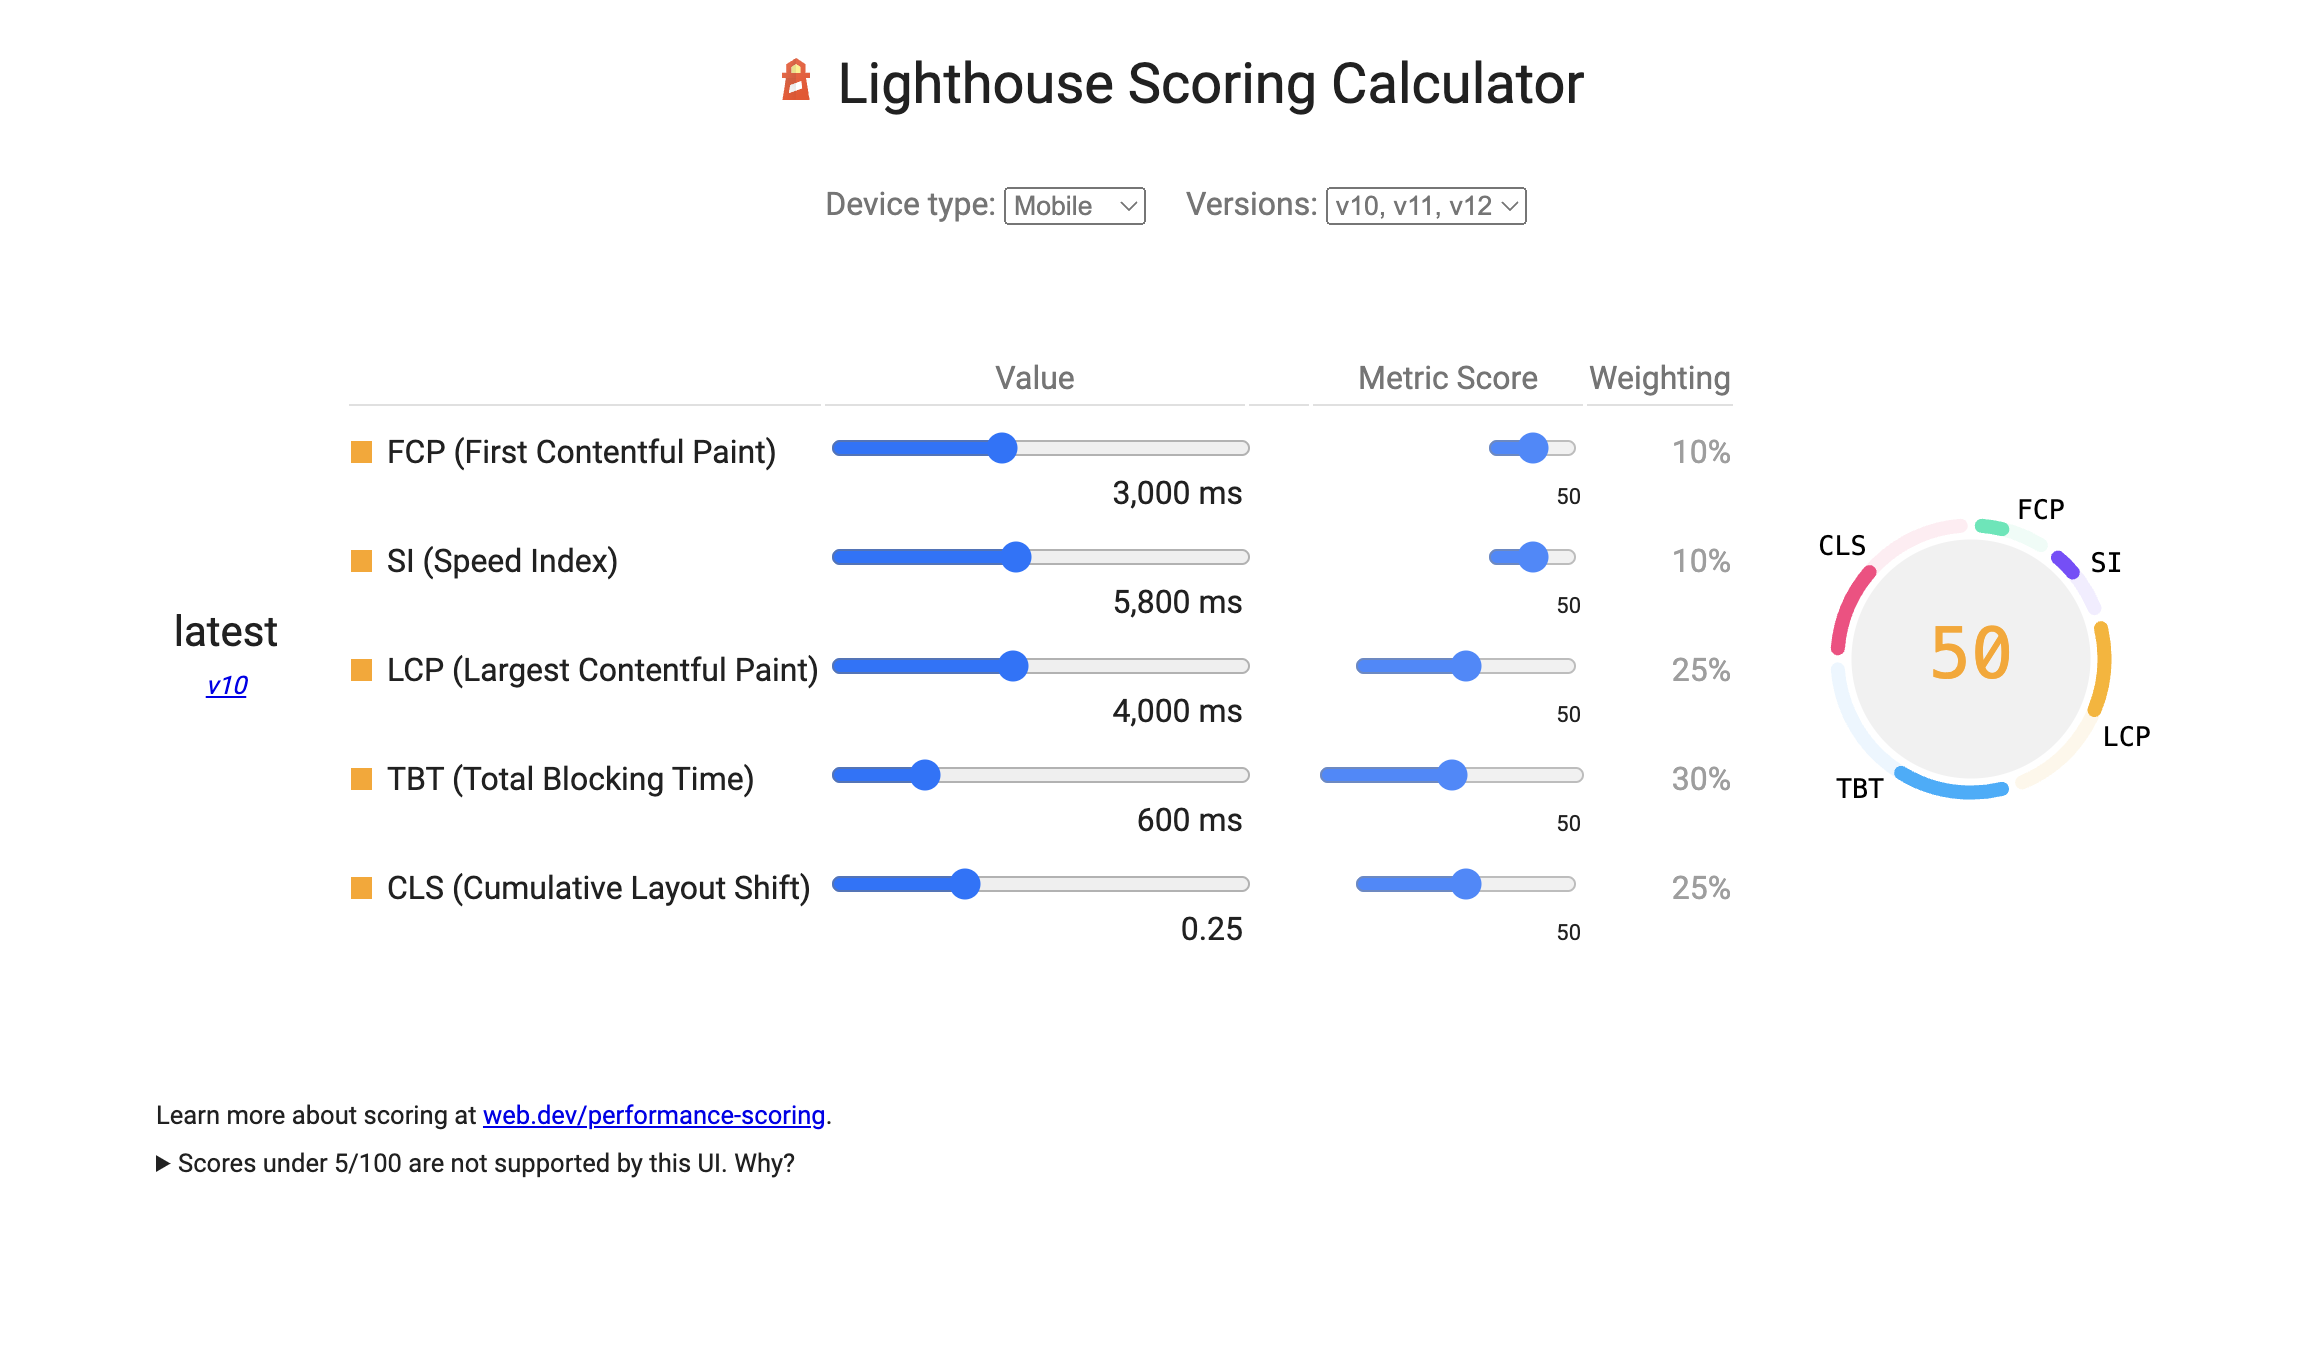 Lighthouse Scoring Calculator
Explanation by example
Let’s simulate a few different network and website development conditions and see how the Speed Index value changes. For this, I will be using a demo website from one of my previous articles.
To paint the picture rapidly, I will mock the following:
- Injecting a render-blocking (non-async) script into the top part of the page
- Simulate long downloading times for the script
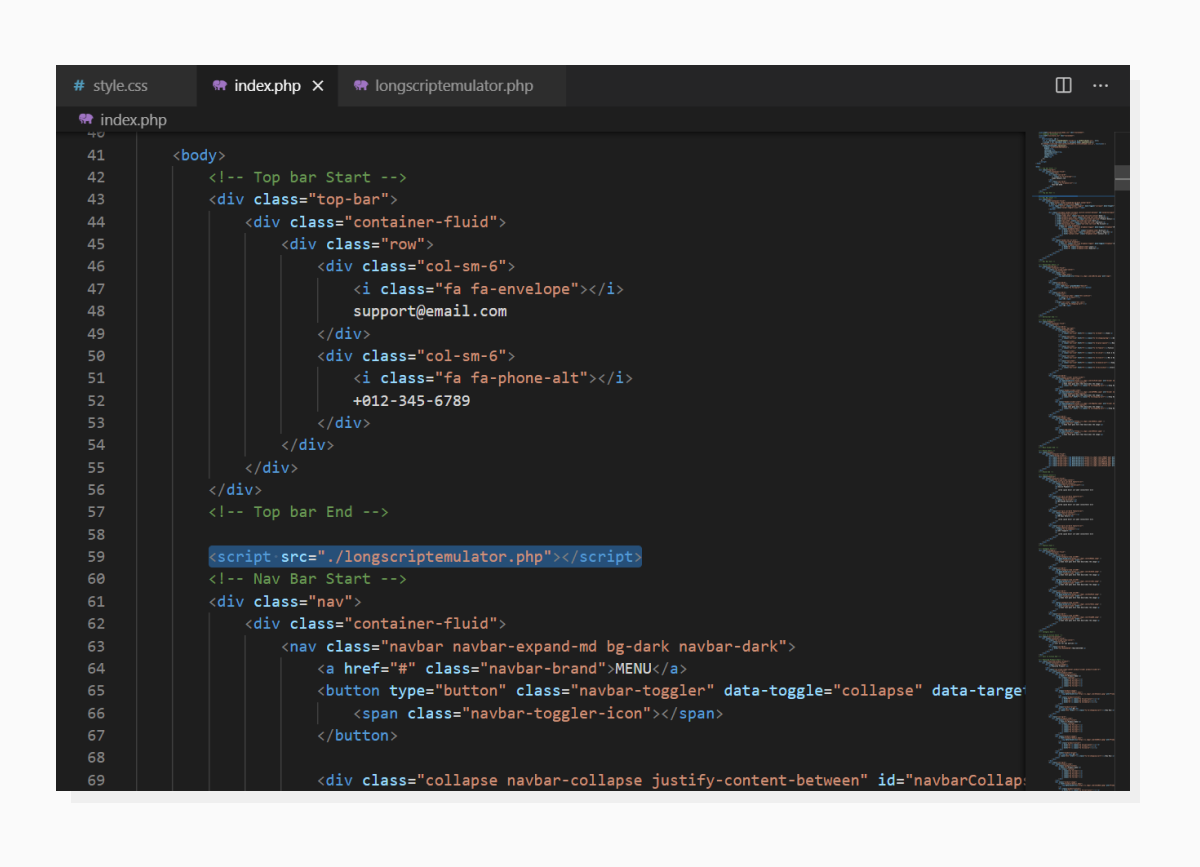 A piece of the example webpage’s source code.
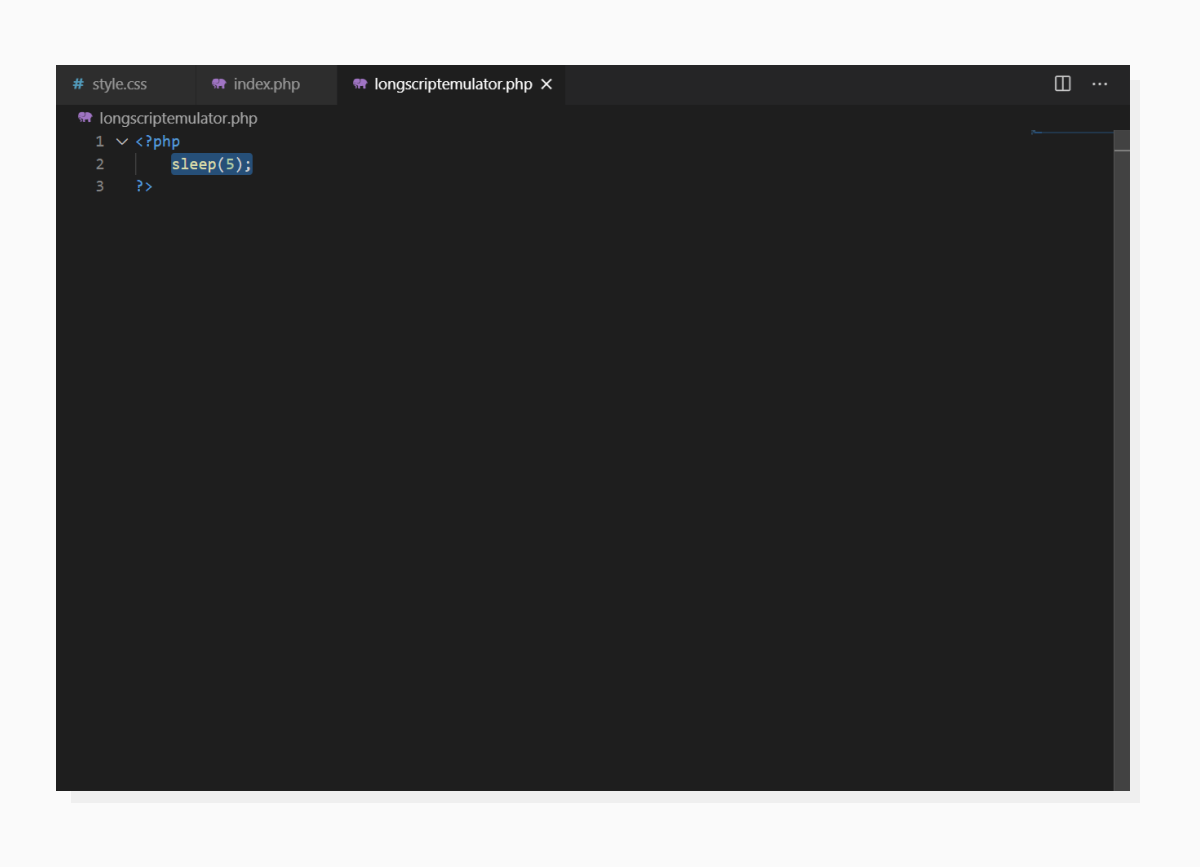 Our simulation of a long network response.
With this setup, the page will:
- Start rendering
- Stop rendering on script inclusion and wait for it to load and evaluate
- Continue loading
With this in mind, let’s run a Lighthouse audit on this page and check out the numbers.
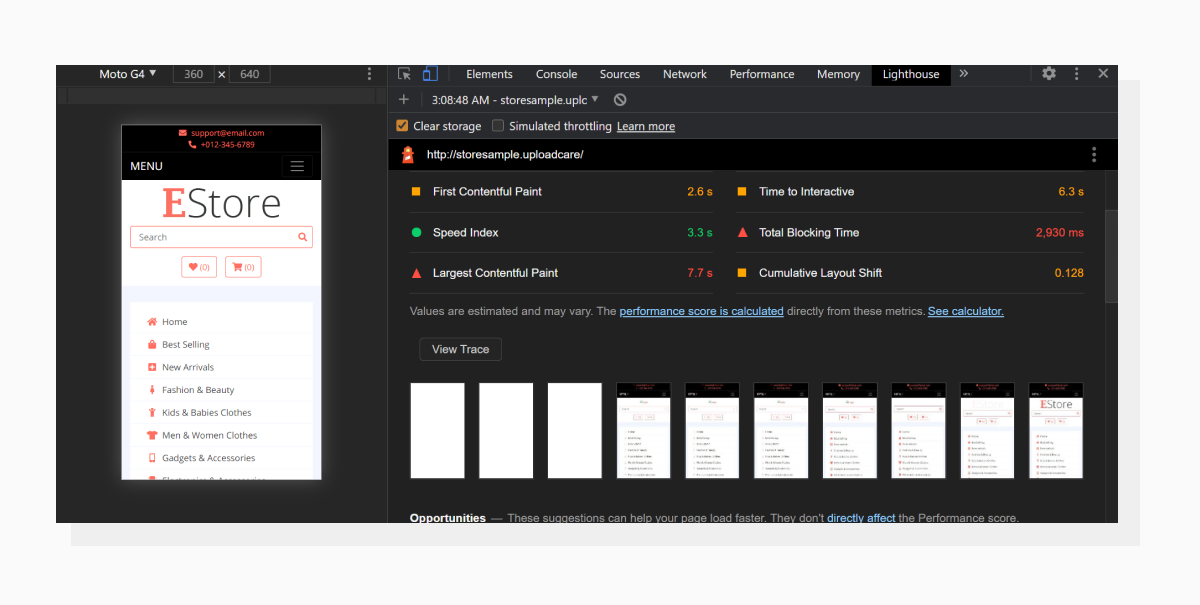
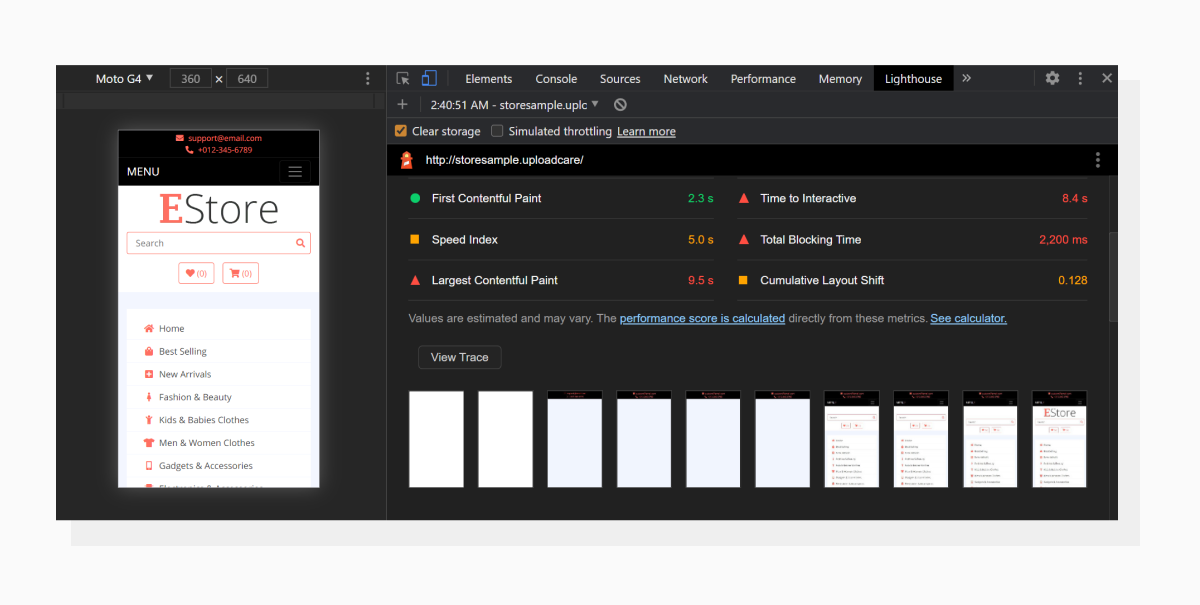 Results of the audit. I zoomed the interface for better visibility.
In the screenshot above, you can see that the Speed Index is in the orange zone with a value of 5.0s.
It’s important to note that this is a visual representation of the page loading process. Our assumptions were right: the page starts loading, then stops after the top bar has been rendered. After that, the rest of the page is displayed quickly.
If we take a look at the contents of the script file, there’s literally nothing (in our case) that absolutely must be downloaded and executed in the top section of the page, so let’s move the script to the bottom of the page — it’s always good practice to defer script loading as much as possible — and run the audit again.
 As expected, the results have improved.
Let’s take a look at the screenshot sequence again. The visual representation of the content gets to the final point quicker, hence improving the perception of speed, and the Speed Index value reflects that.
How to improve Speed Index score
Earlier in the article, we discussed the importance of optimizing your scripts’ loading times and putting them in the right spot on the page. Now let’s go through the audit and figure out what information is the most pertinent for our purposes.
First, I’d recommend looking at the Diagnostic section, especially these three audits:
- Ensure text remains visible during webfont load
- Minimize main-thread work
- Reduce JavaScript execution time
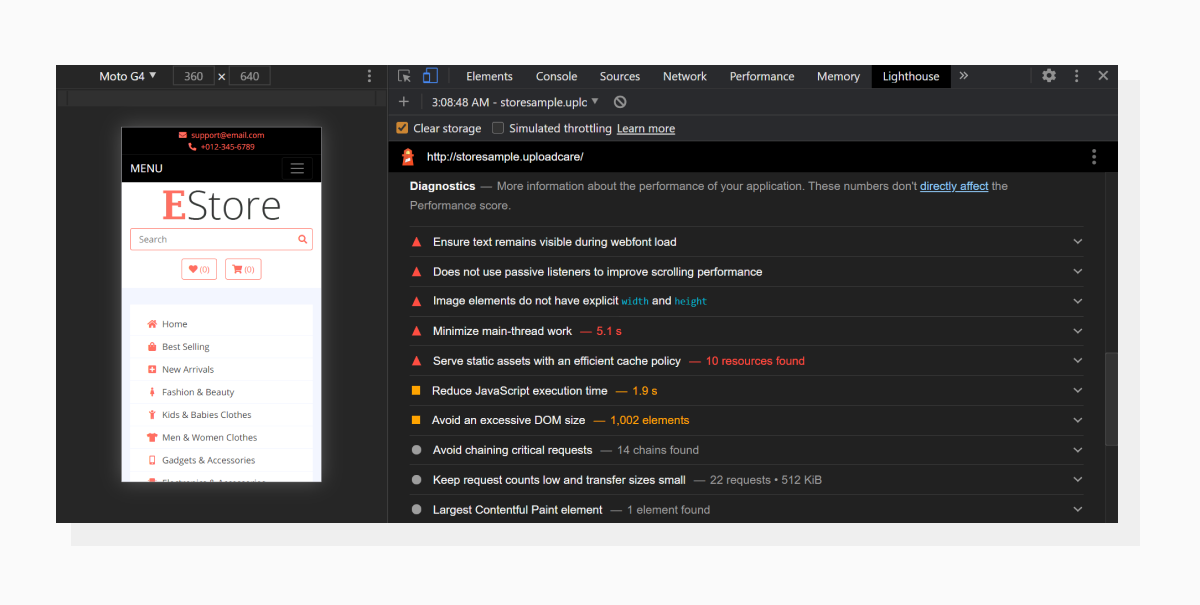 Color grades demonstrate to which extent a separate audit could be improved.
1. Avoid showing invisible text
While this may sound confusing, it’s actually pretty straightforward: don’t wait for the font to load. Instead, display a font that already exists in the user's system.
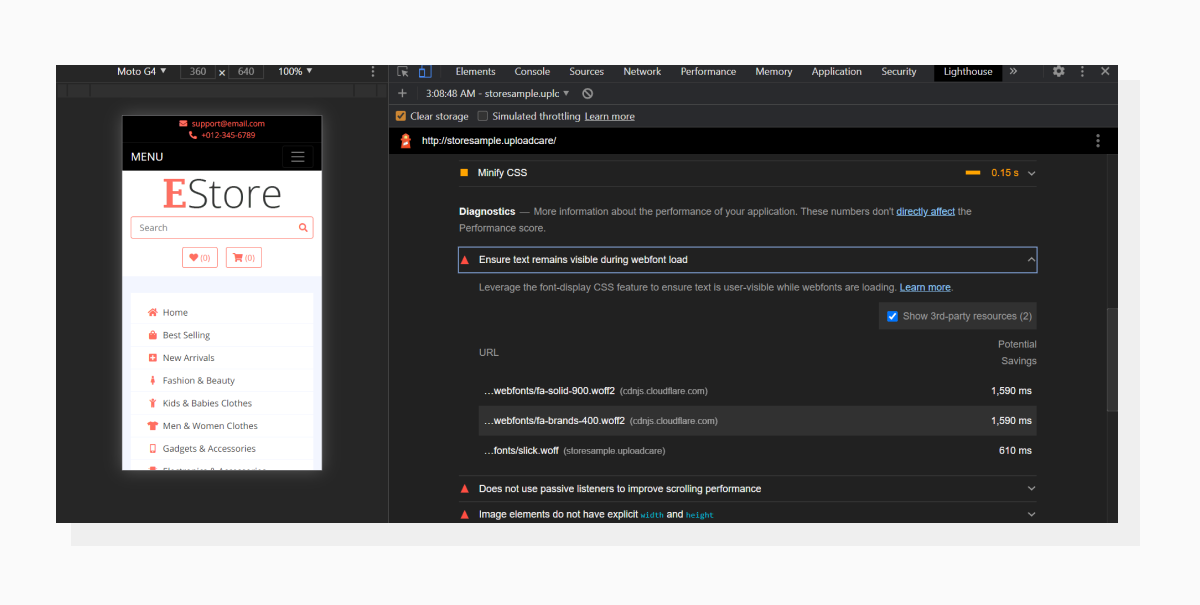 A list of font files that require attention.
You can do this by utilizing the font-display: swap; CSS property like in the code snippet below:
@font-face {
  font-family: 'Pacifico';
  font-style: normal;
  font-weight: 400;
  src: local('Pacifico Regular'), local('Pacifico-Regular'), url(https://fonts.gstatic.com/s/pacifico/v12/FwZY7-Qmy14u9lezJ-6H6MmBp0u-.woff2) format('woff2');
  font-display: swap;
}
Or, if you use Google Fonts, use the &display=swap parameter added to the font URL, like this:
<link href="https://fonts.googleapis.com/css?family=Roboto:400,700&display=swap" rel="stylesheet">Also, you can fetch fonts earlier using the preload attribute in the <link> element together with the as="font" attribute.
2. Minimize main-thread work
The main thread of the rendering process is busy parsing the HTML, building the DOM tree of the document, parsing the CSS and Javascript, as well as executing the latter.
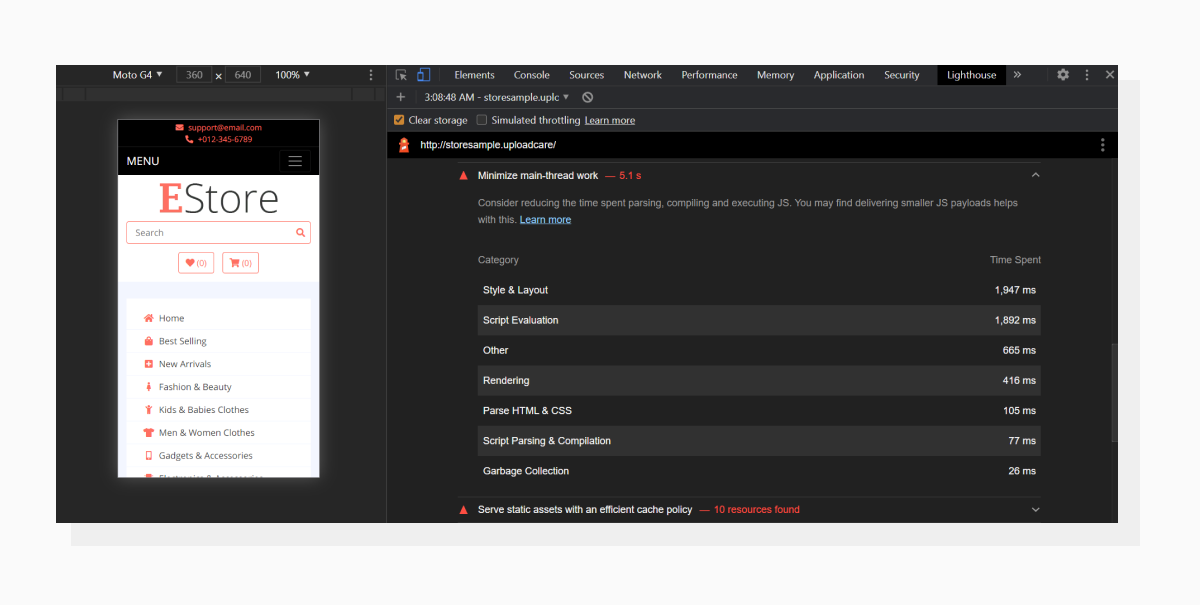 Minimize main-thread work breakdown.
The faster the browser deals with the HTML and CSS needed to display the final page section within the viewport, the better the Speed Index values will be. With this in mind, try excluding Javascript-related tasks as much as possible. To do that:
- “Lazy-load” Javascript that can be deferred.
- Use the minimal required CSS (also called the Critical CSS path) to display the first visible section and defer the rest.
Regarding Critical CSS, I’ve already described some ways to deal with it in this article about First Contentful Paint.
Speaking of deferring Javascript: on one of my recent projects, I got a decent score boost by deferring form initialization. Initially, forms were rendered inside hidden modals during the page load. Postponing form initialization until the moment when a certain modal was opened added around 25 points to the overall Lighthouse score, and improved Speed Index as well.
3. Reduce JavaScript execution time
There are several ways your assets (in this case scripts) can negatively affect the loading process:
- Network: Heavy scripts take more time to download
- Parsing and compilation: All the prep work blocks the page rendering process
- Execution: Unoptimized scripts take longer to finish running
- Memory: Overloading browser memory will make the page slow as well
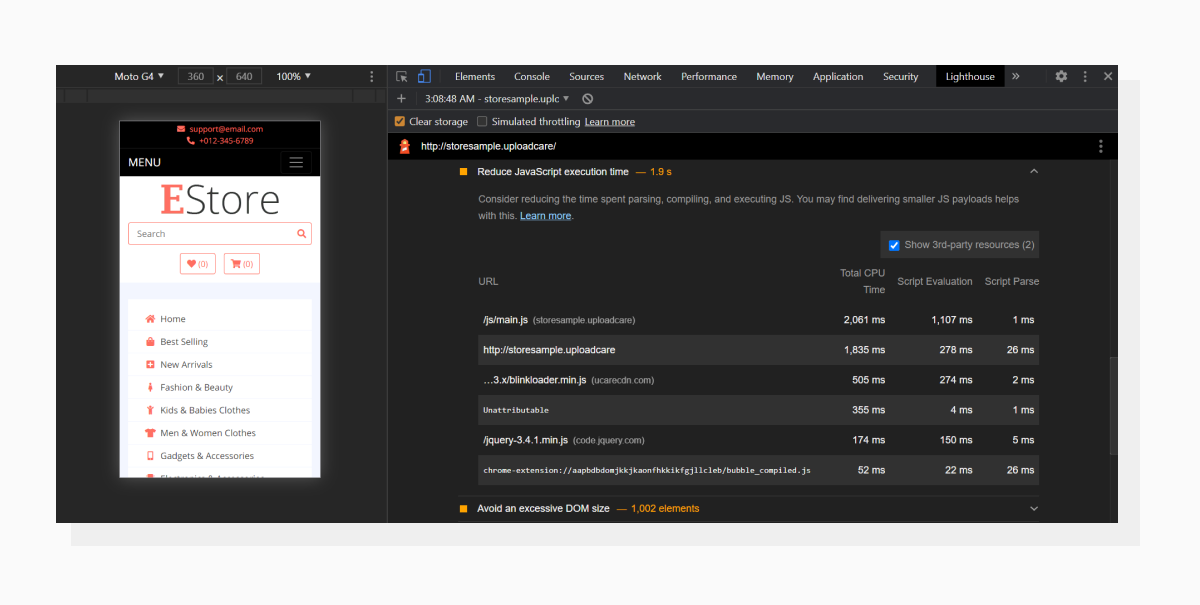 Script evaluation is usually the most optimizable part here.
All of this affects the time it takes for a script to give control back to the page rendering process. This one is closely related to the previous section.
4. Eliminate render-blocking resources
In the Opportunities tab there’s a closely related audit called Eliminate render-blocking resources.
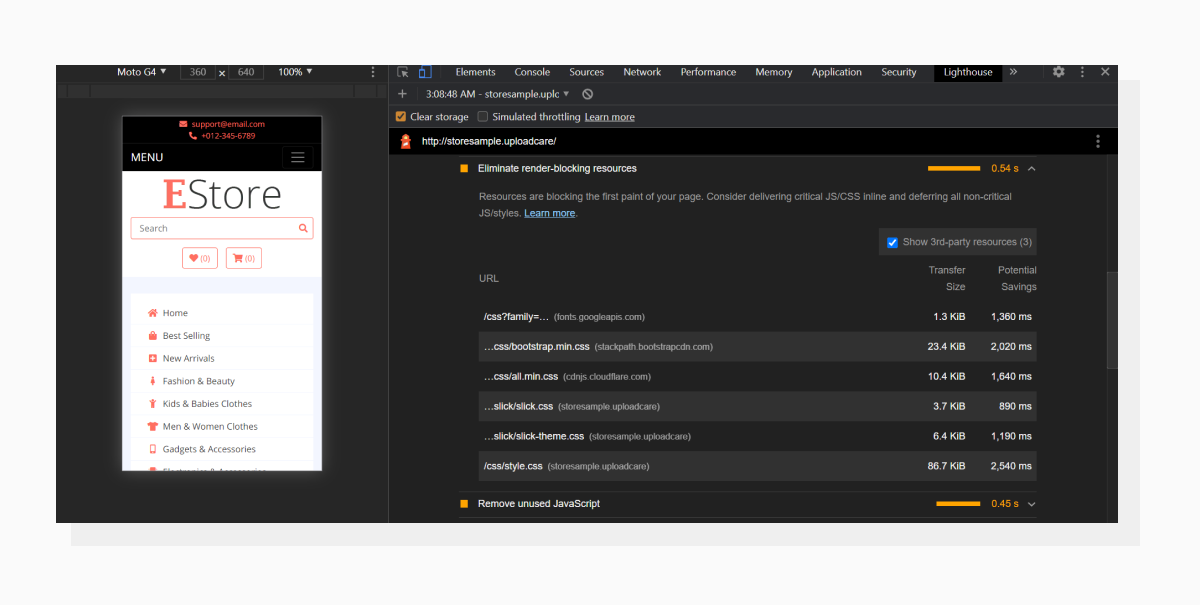 This is another bottleneck that can affect Speed Index.
Everything that blocks the rendering process takes its toll on the Speed Index score. Try to put third-party scripts at the bottom of the page or trigger them conditionally.
I’d like to take this moment to advise you not to make improvements solely to see better numbers. First try to determine which functionality and content a potential visitor would need first and foremost.
5. Inspect graphical content
I’m putting this at the end of the list because it’s not directly related to development like the other improvements, but it can have a huge impact.
Big unoptimized images occupy bandwidth just as much as inefficient scripts do. Before you go fiddling with your scripts, consider these two improvements to get a better Speed Index score:
- Serve properly-sized images. There’s no need to load a 4K image for a small thumbnail on a mobile screen.
- Use lazy loading for offscreen images. Speed Index is about the content that’s visible within the viewport.
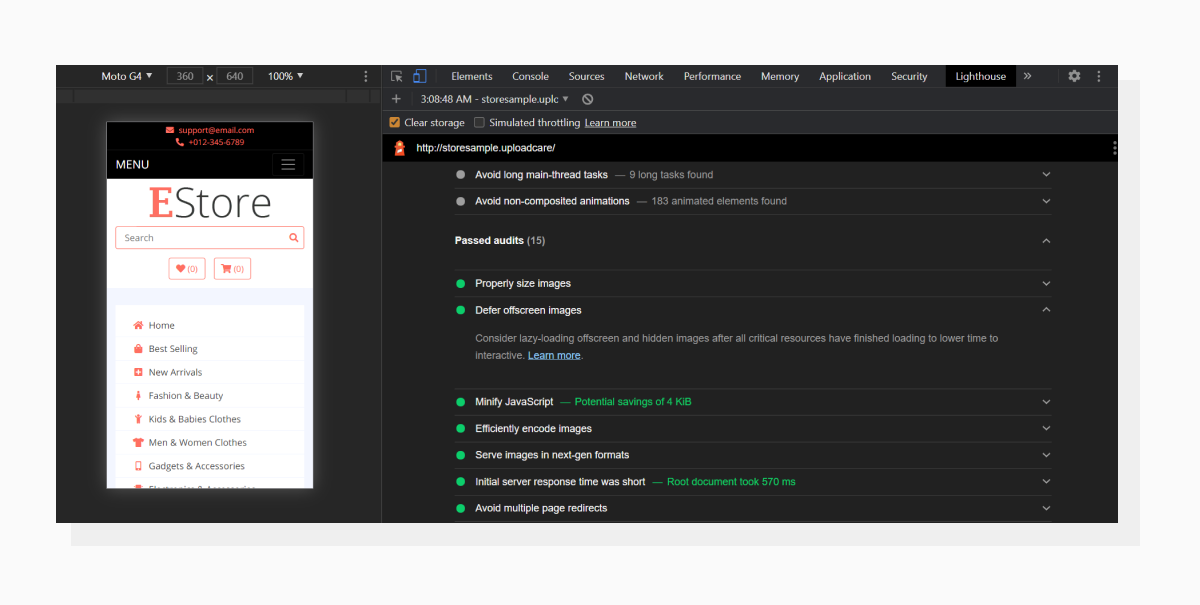 The audit is green here because I’m using Uploadcare’s Adaptive Delivery to optimize images and lazy-load them.
Why should I care?
In this modern age of shortening attention spans, people are getting used to instant content. Even if you have engaging content on your website, poor speed performance can lead to higher bounce rates, hence lower conversion numbers.
Again, if you don’t want to dive into the rabbit hole of script redevelopment right away, I would recommend at least one of these optimization techniques. Give it a try to see how your website can benefit.
To take it off of your shoulders, Uploadcare provides an Image CDN. You type the operation name right in the image URL, and we optimize the image on the fly. Compress, crop, resize without any quality loss and manual work.