How to become an eLearning market leader during the pandemic
Last edited:
As people continue to move online because of the global lockdown, many have started new educational courses to spend their time productively during forced isolation. This has caused an increase in the number of digital learners, which is definitely a once-in-a-lifetime opportunity for eLearning businesses.
But with great opportunities come challenges: companies needed to react quickly to welcome and engage millions of newcomers. With this research, we decided to dig deeper into this issue and answer two questions:
- Is the number of digital learners really growing?
- How good is the eLearning landing landscape at handling that growth?
While looking for the answers, we found several useful insights that surprised us, and we believe they will surprise you as well. Beyond that, we shared some ideas on how eLearning businesses can pull ahead of the competition during the pandemic.
A word on the research: what we did
To investigate how eLearning web performance has changed during and after the pandemic, we sampled 150 eLearning companies with different characteristics:
- Google index size
- Average number of visitors
- Implemented technology
- Web performance parameters
These attributes were collected from BuiltWith, SimilarWeb, PageDetox by Uploadcare, and Google Lighthouse. The sample consists of both big and small platforms, and represents a wide range of company size and other parameters of the entire industry. Note that we focused on these platforms’ main pages, as they basically do the job of acquiring new users. Now let’s take a look at our key findings.
The number of users is really growing, but not for everyone
In Uploadcare’s sample, the number of users is growing for 41% of the companies, and 20% of eLearning websites are dropping in traffic. Hence, we can divide the companies into at least two groups: the happy ones whose traffic is growing, and the sad ones whose traffic is falling.
Note that “happy” and “sad” are just labels relating to, respectively, the growth or decline in average monthly traffic — nothing else. There’s no judgment of the platforms’ business models or content, or any other substantive attributes.
Most companies fail to convert the increased traffic as effectively as they could
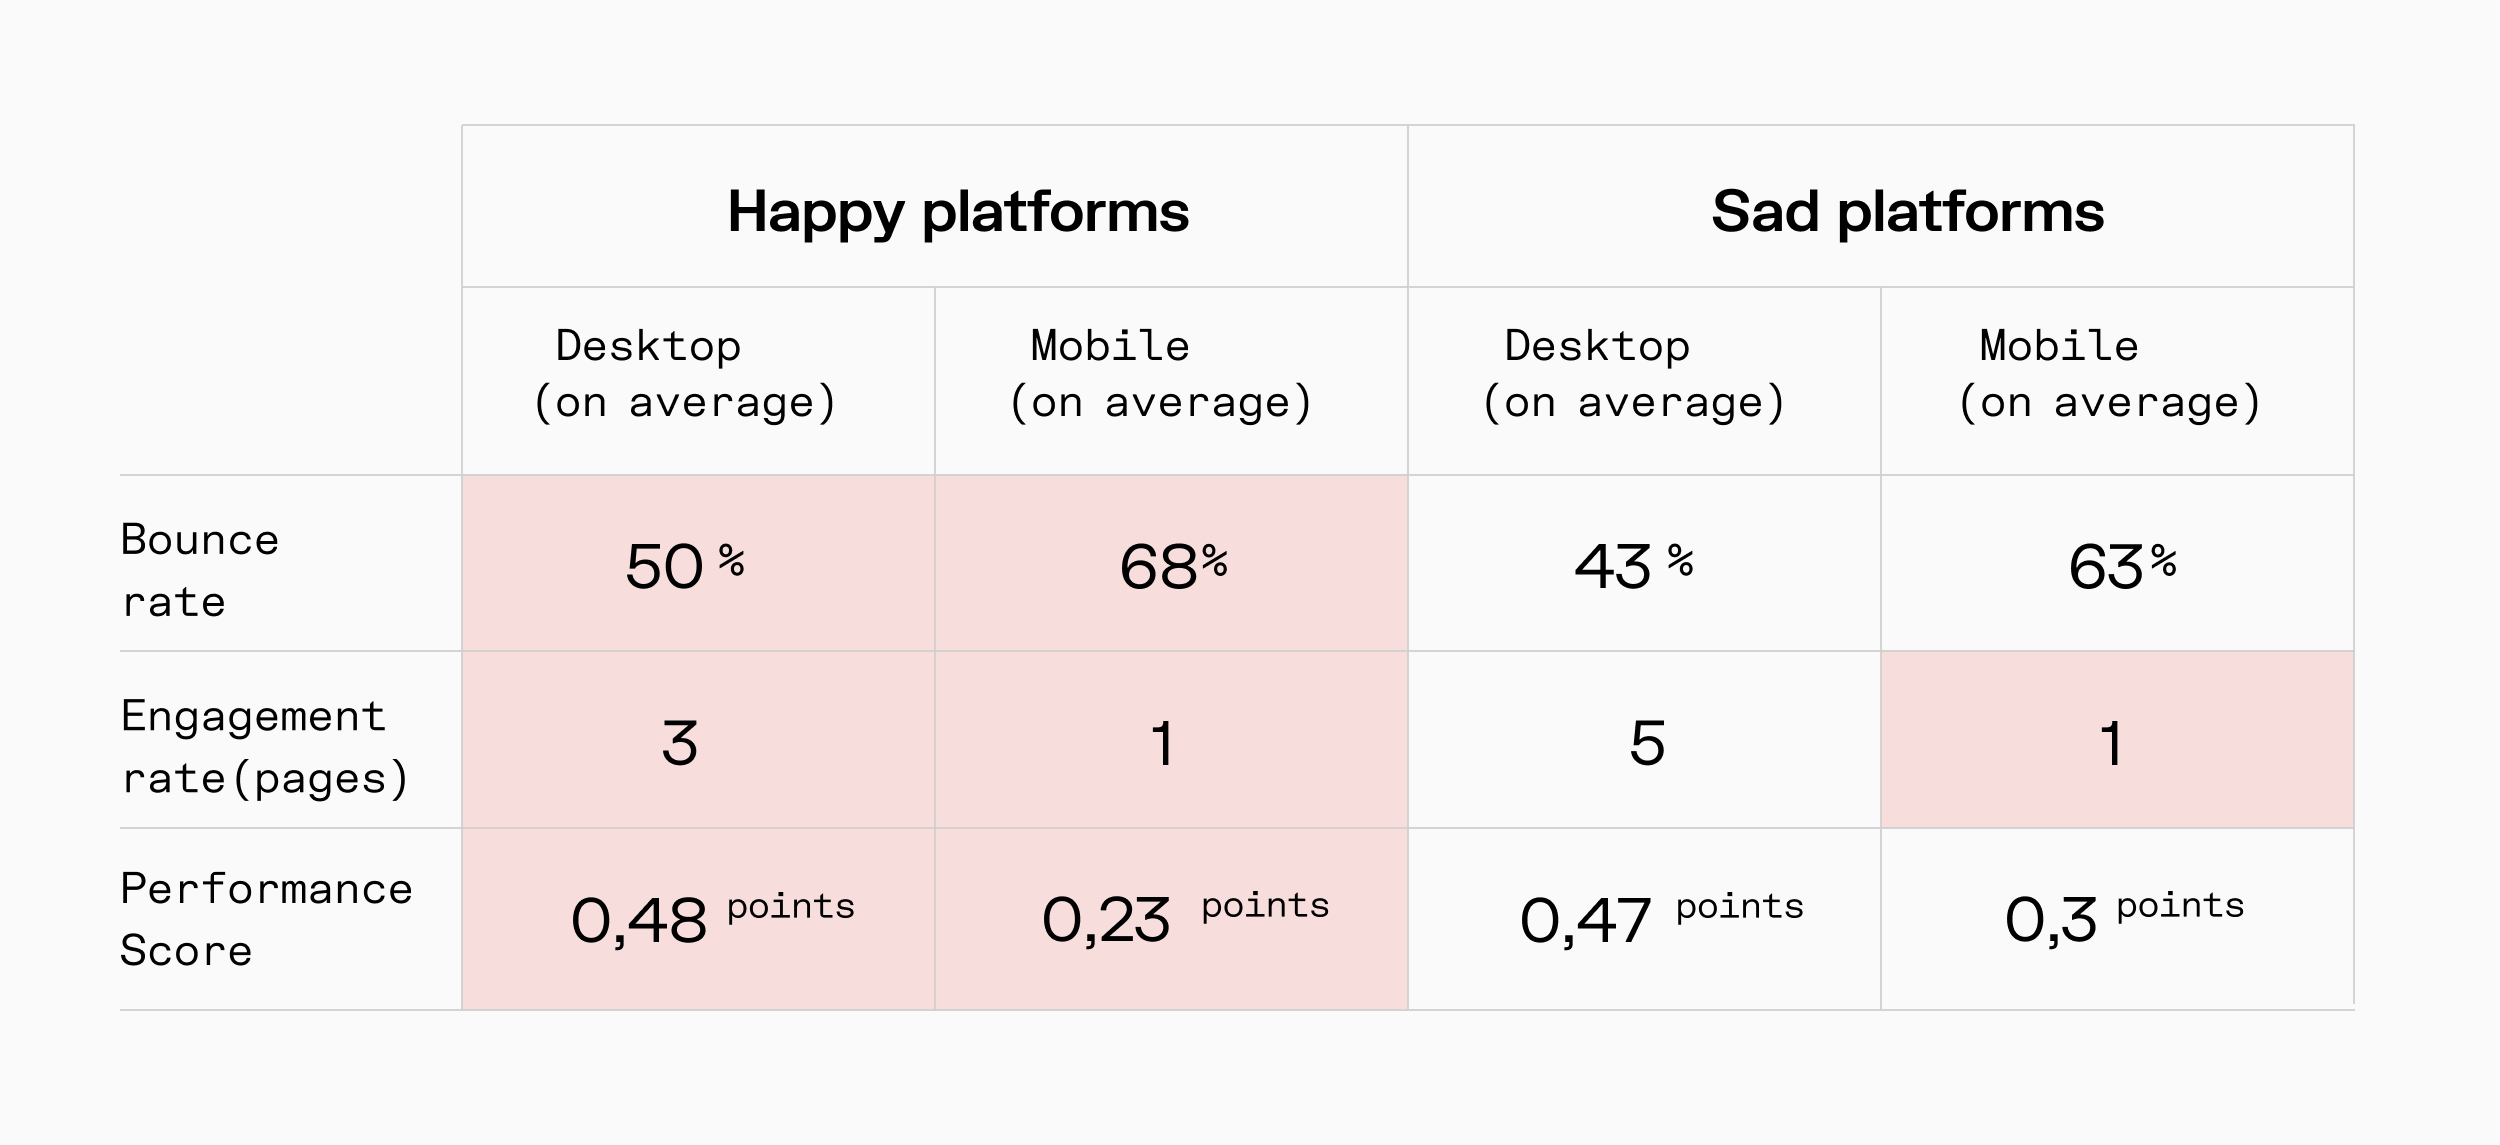
Typically, a web performance score of 90 or higher is considered very good, and below 50 is poor. Tests have shown that the average performance score of eLearning websites is just 48. Only 9% of eLearning websites have a satisfactory Performance Score.
 Happy vs Sad platforms’ web performance metrics
This means that eLearning companies aren’t making the most out of the current situation: the number of users has grown, but the companies weren’t ready to provide a seamless user experience and turn all the newcomers into active users.
Poor media optimization is what holds eLearning companies back
Despite different traffic patterns, happy and sad platforms have actually quite similar problems in web performance. Where do these come from? The answer is simple: most likely, they have poor optimization of images and other media, if any at all.
Images and UX/UI elements take up over 50% of websites’ page weight. Lots of unoptimized visual content leads to higher load times, which, in turn, means an interrupted customer journey and degraded online experience. In other words, it’s harmful to the quality of experience (QoE), the level of user engagement, and the conversion rate. This pertains to the sad platforms as much as it does to the happy ones.
We highlighted 3 major problems eLearning companies need to address to perform better:
Problem #1. Unoptimized images
Unoptimized images lead to heavier pages and higher page load times. Weighty images slow down pages, which leads to degraded web performance and increases the bounce rate. A high bounce rate means degraded engagement and lower conversion; in turn, a low QoE leads to degraded business performance.
Problem #2. High mobile bounce rate
Poor mobile performance disrupts the customer journey and leads to degraded online experience which, in turn, lowers engagement and conversion rates, ultimately leading to degraded business performance.
Problem #3. Poor desktop performance
High desktop image weight and high main page weight lead to high desktop load times, high bounce rate, and low engagement rate. Weighty images slow down pages, triggering degraded performance. This problem is specific to the sad platforms.
Solving performance issues can help you pull ahead of the competition
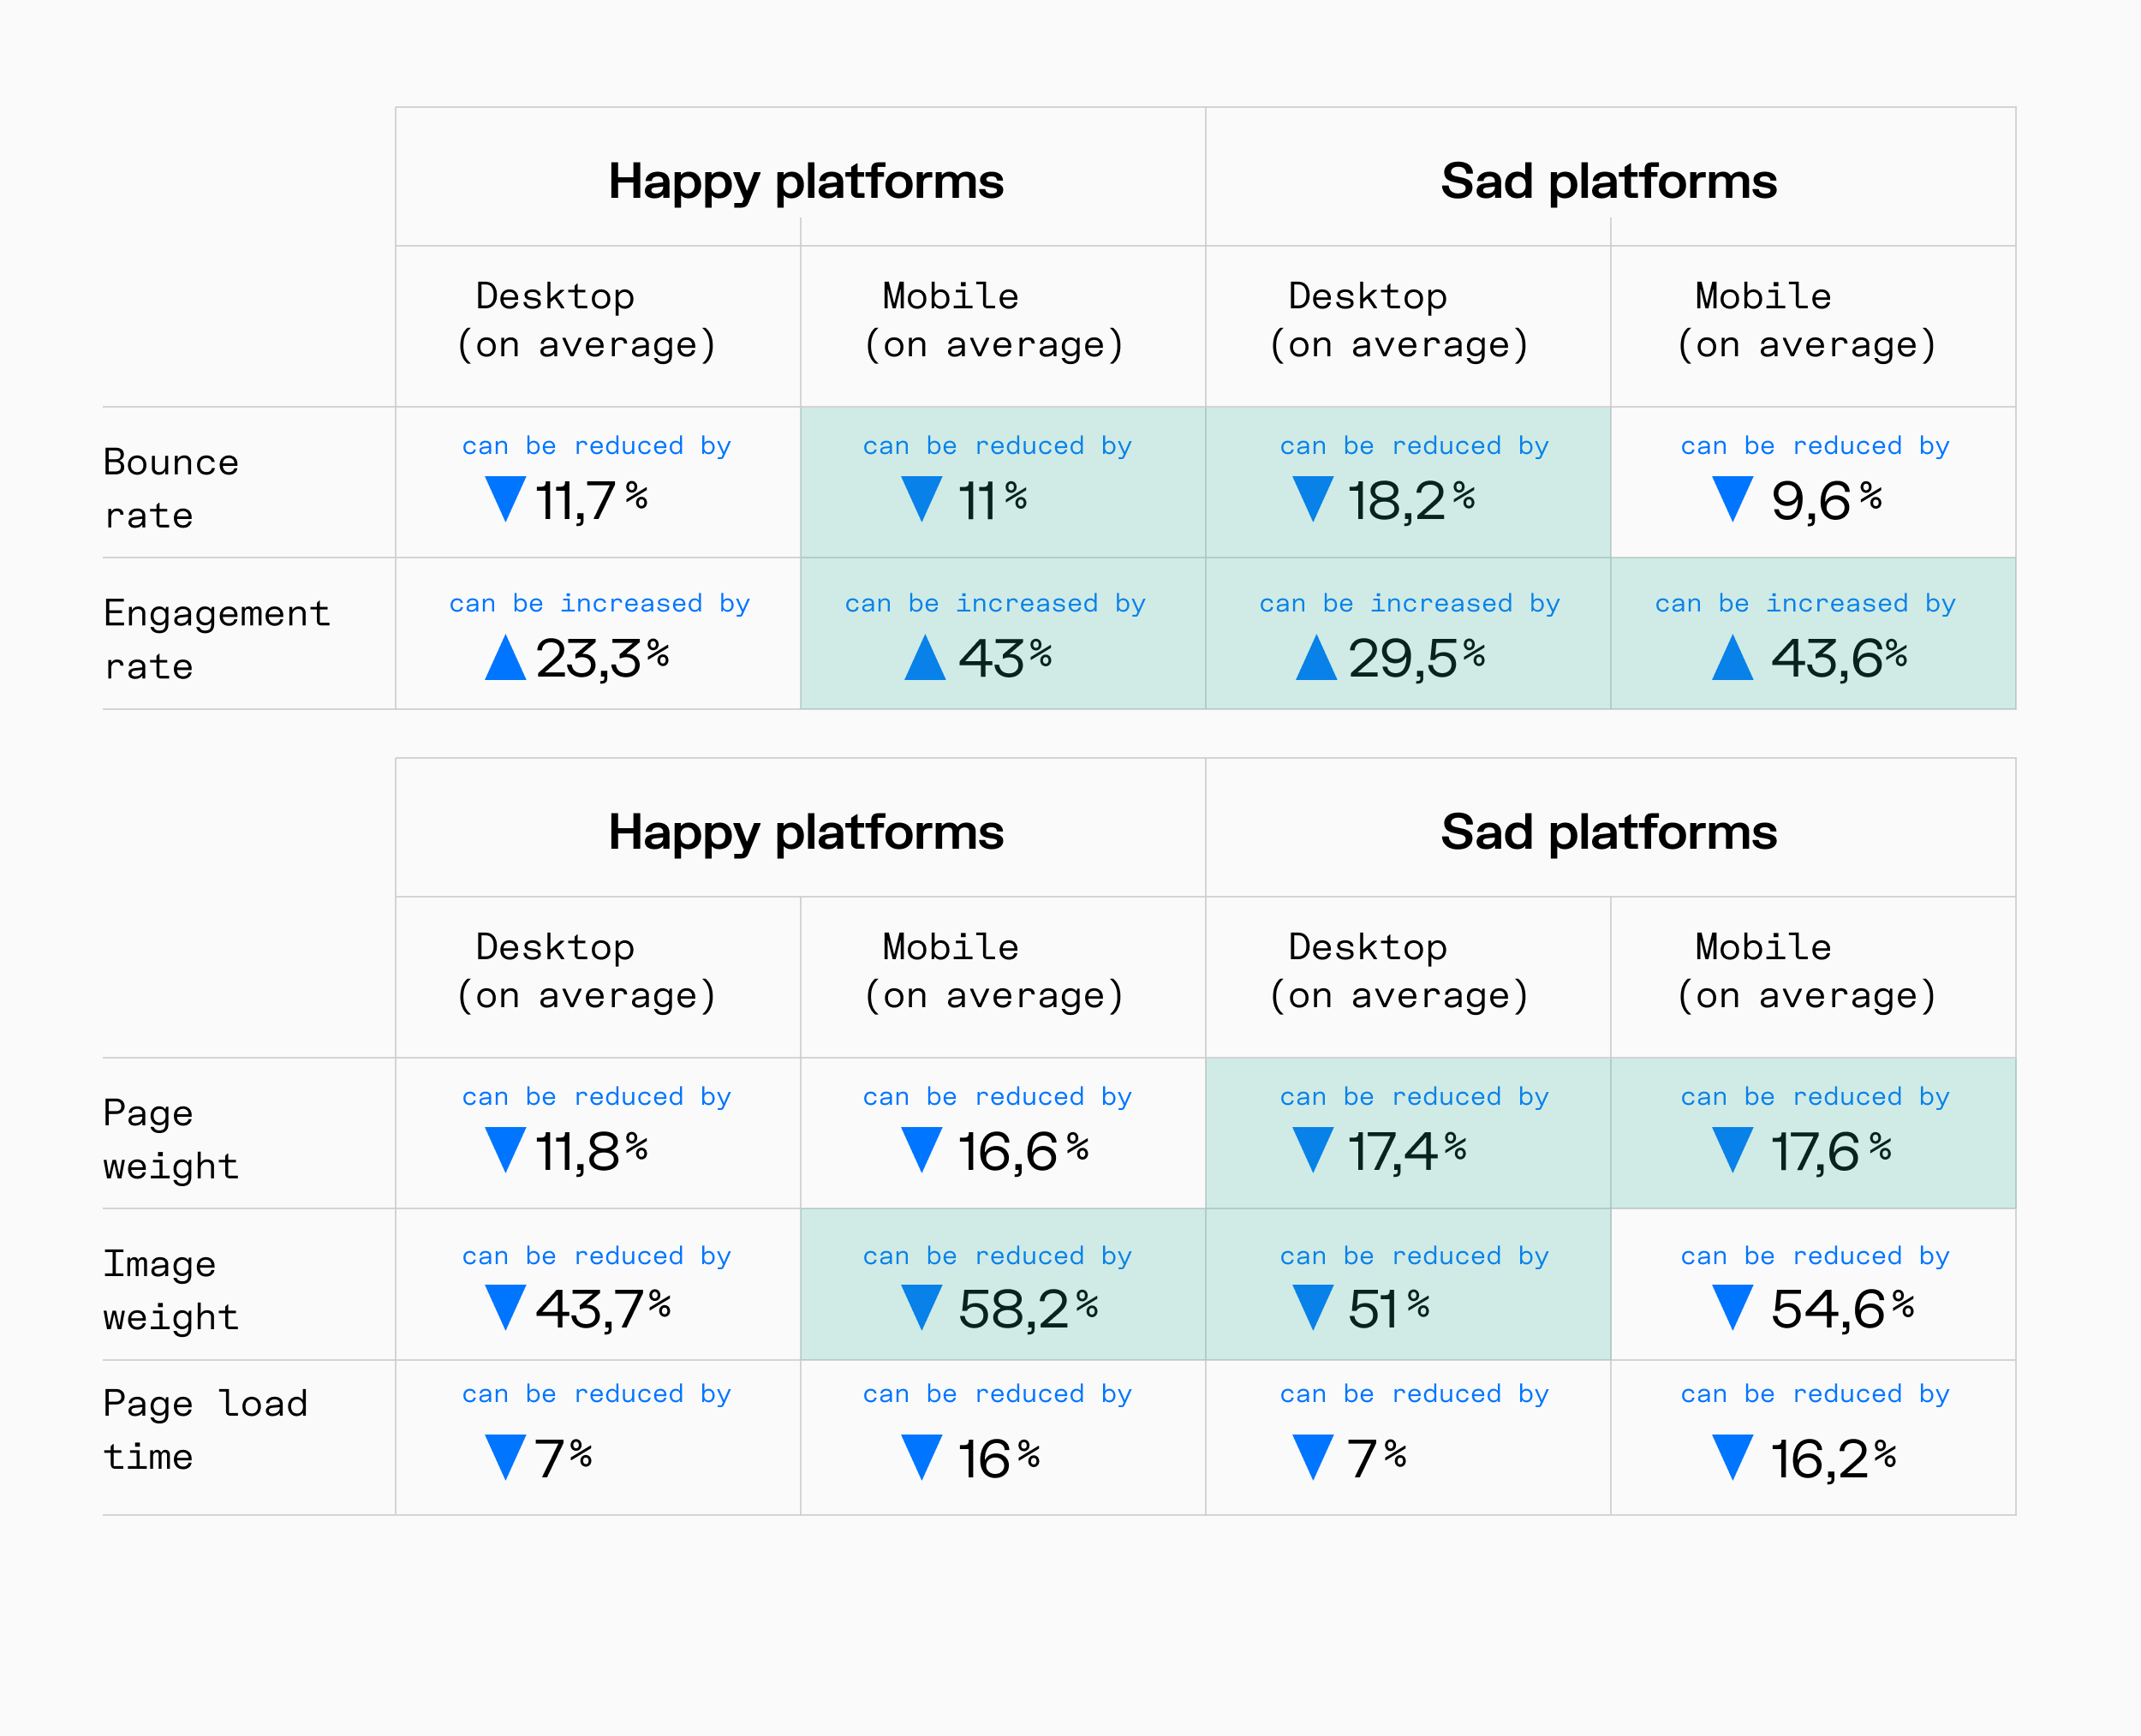
Image optimization can improve the web performance of both types of platforms, and for the sad ones, the improvement margin will be even higher. Happy platforms also have plenty of room for improvement, and can become more competitive with higher business metrics. Here’s what their metrics can look like after optimization:
 Web performance metrics after optimization
By improving your web performance, you boost user experience and engagement, which can help you convert more visitors into users and beat the industry competition during the pandemic.
Find four image optimization solutions in the full version of the report
The full version of this report provides more details about all the statements described above, plus offers four tactics and technologies to help you fix your performance issues all at once. Get your copy of the report right in your inbox.