Time to First Byte: What it is and how to improve it
TTFB (stands for Time To First Byte) is a lab and field performance metric that indicates the time between the request for a resource and when the first byte of data begins to arrive to a client.
In this article, we will explore the role that TTFB plays in modern web performance optimization, how it impacts Core Web Vitals metrics, and ways to improve it.
The post has theoretical and practical information. If you want to see how optimizations are made on a demo website right away, feel free to start with “Improving TTFB: an� example” section directly.
Prerequisites
- Understanding of basic client-server architecture principles
- Access to edit app configuration parameters/code
What TTFB looks like
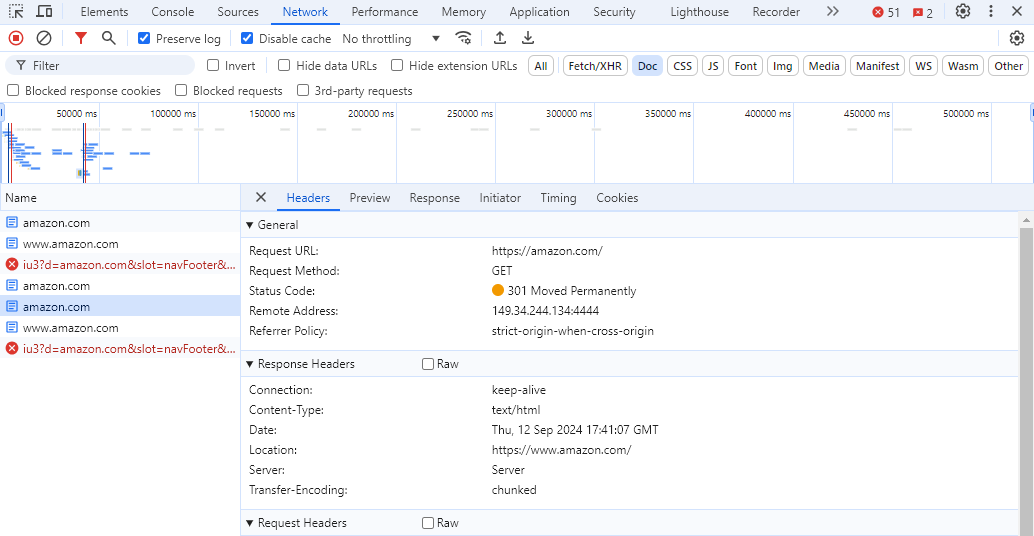
Let’s get acquaintanced with the visual representation of the metric. There are different ways to measure TTFB based on specific environments, but let’s look at the most obvious first: DevTools Network Tab.
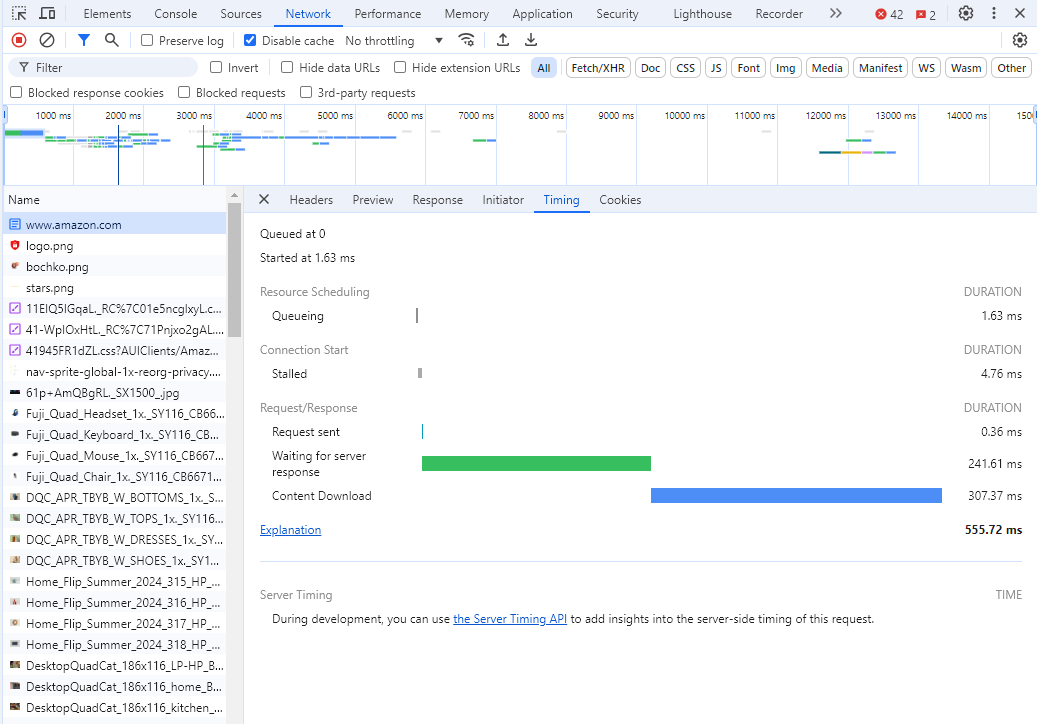 TTFB in DevTools (Request sent + Waiting for server response)
To get an idea of what the TTFB is, open the website that you’d like to check, go to the DevTools Network tab, and reload the page. You can inspect any request you need, in this case, it is a request to Amazon’s homepage. The TTFB in this case is the sum of the “Request sent” and “Waiting for server response” timing reports.
How TTFB affects other metrics
TTFB is not a Core Web Vitals metric, so it is not necessary to strive for great TTFB performance just for the sake of it. However, the metric comes first in the resource-loading waterfall, meaning that other important metrics like LCP, INP, and CLS directly depend on it. Here’s the diagram showing guidelines for TTFB values:
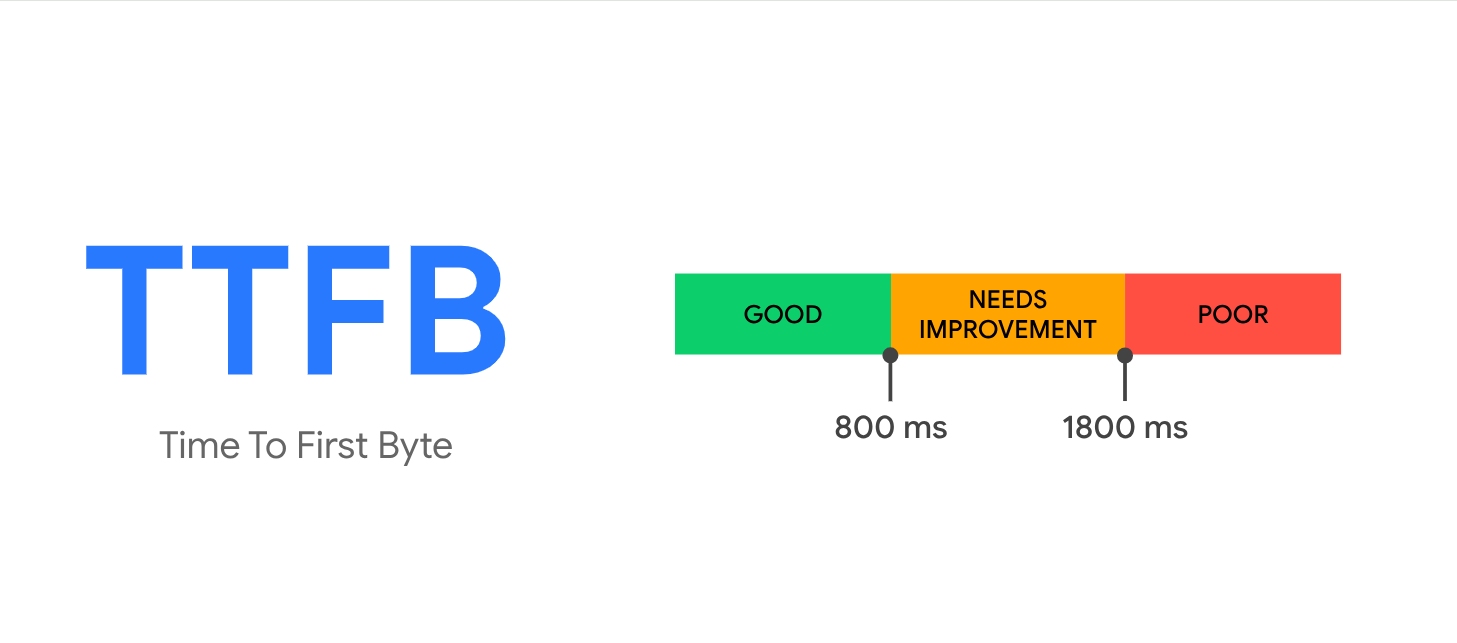 TTFB evaluation diagram
Importance of TTFB for user experience and SEO
In the modern Web, UX and SEO are interconnected. Core Web Vitals align with what Google’s search engine seeks to reward. Making sure that TTFB is optimized removes the bottleneck that could delay the page from becoming visually loaded and interactive.
Factors affecting TTFB
The metric covers the whole cycle of client-server communication:
- Total redirect time
- DNS lookup
- Connection and TLS handshake/negotiation
- Server processing time
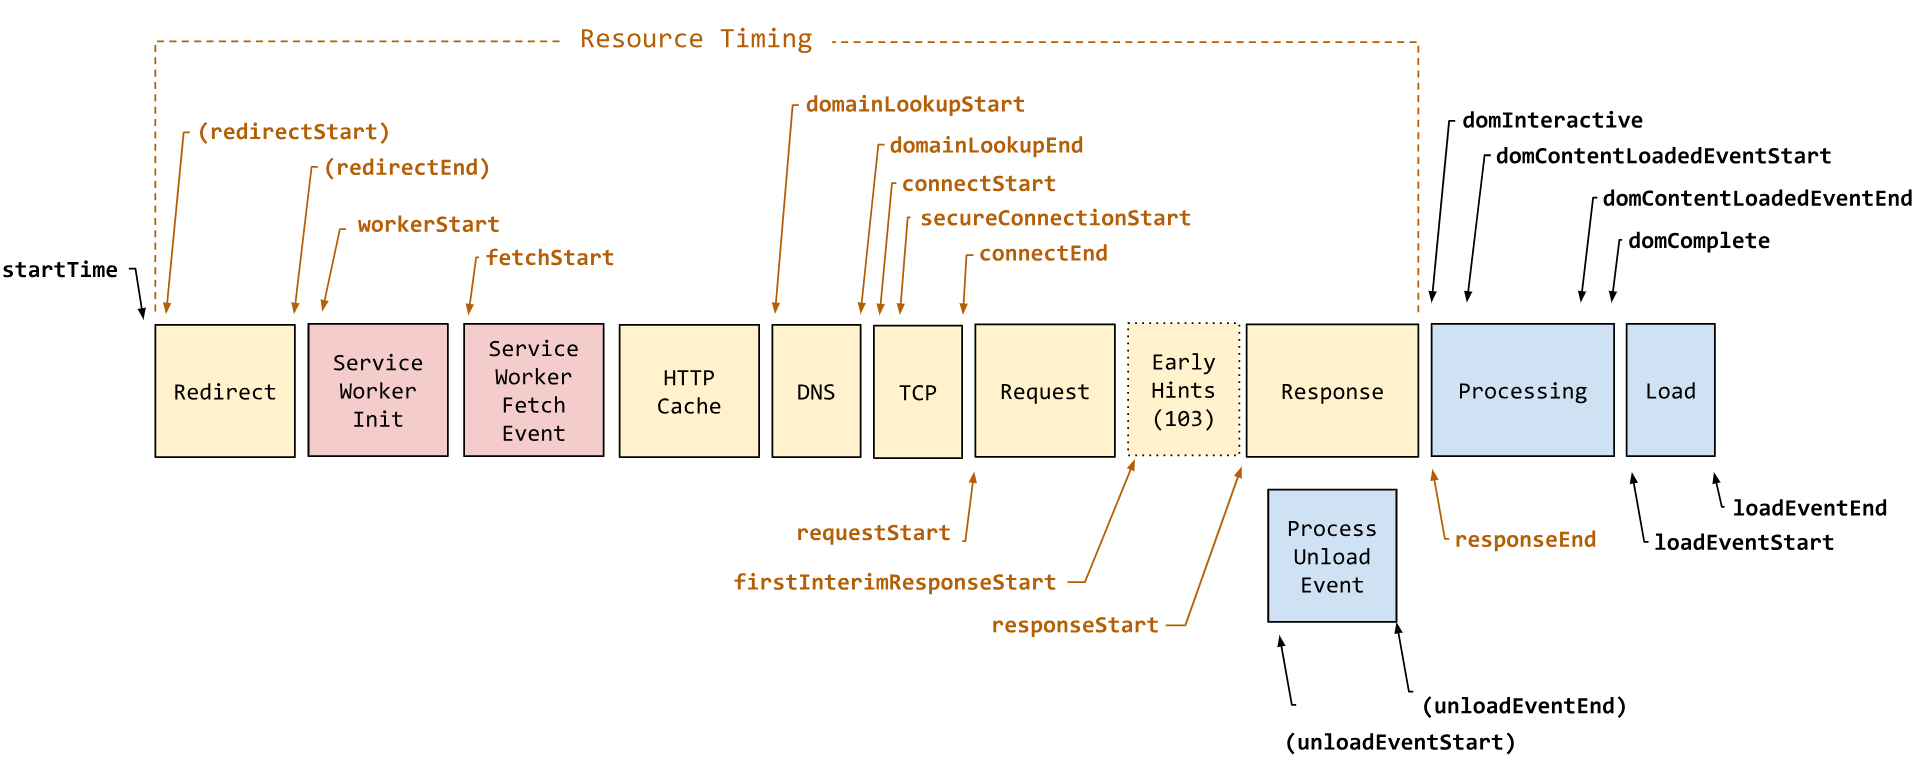 TTFB is the time between startTime and responseEnd (source: web.dev)
Having these defined, let’s take a look at the ways how TTFB could be optimized at each step.
Improving TTFB: Reduce redirects
Redirects happen when a request for a document receives a response that tells the browser that the document is located somewhere else. The browser then follows the path to the target document. Some websites may have multiple consequent redirects, especially the ones where traffic is fed from advertisement platforms. While a single redirect may not cause much harm, multiple definitely could.
Generally, there are two types of redirects:
- Same-origin redirects — redirects happen within your domain
- Cross-origin redirects — redirects initially occur before the request hits your website, for example, ad providers or link-shortening services.
Same-origin redirects is the category we have control over. Take a look at the real-world example from Amazon.
If you type amazon.com (supposedly http schema) it takes you to https://amazon.com which then redirects to https://www.amazon.com.
So wherever you go, you end up at the same location. This is how the first request looks in DevTools:
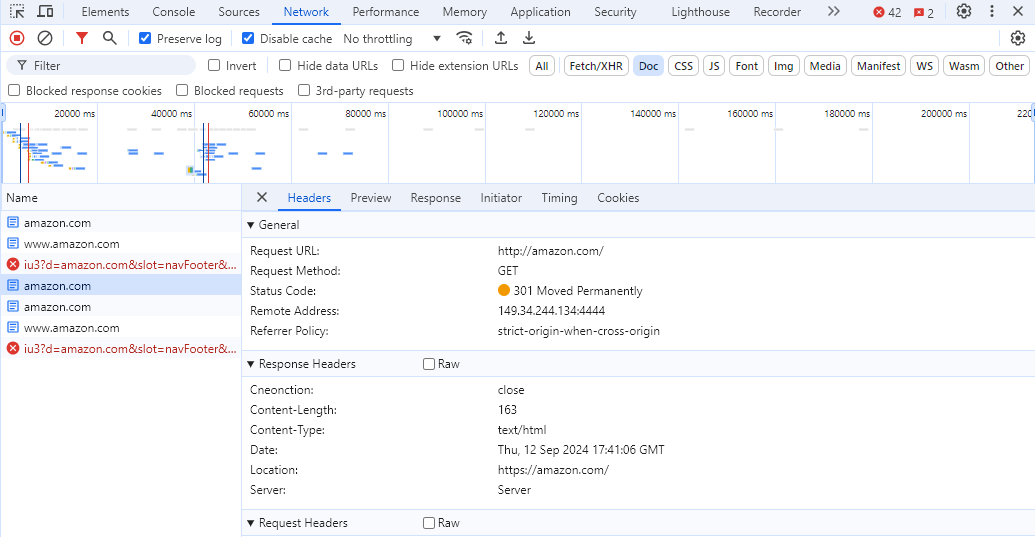 Redirecting http://amazon.com (Request URL) to https://amazon.com (Location)
And the redirect to the www version looks like this:
 Redirecting https://amazon.com (Request URL) to https://www.amazon.com (Location)
You can also see the redirect chain by running PageSpeed Insights report. The tool also calculates potential savings:
 Amazon.com redirect chain reported by PageSpeed Insights for mobile
Consider the following when optimizing redirects:
- If you have several entry points like in the example above, consider having one of them as primary and use redirects to send traffic to this preferred URL without multiple hops.
- If you changed the URL of a resource permanently, consider using HTTP 301 redirect code. This lets search engines know that your new URL is the canonical one, and it is more likely that the link in relevant search results will update to the less-redirected one.
- Be consistent with trailing slashes. There may not be a difference between
example.com/sample-pageandexample.com/sample-page/in terms of content. But when it comes to redirects, try sticking to one URL format. - Use server-side redirects where possible. Server-side redirects come before client-side (HTML and Javascript ones) and happen faster.
Improving TTFB: DNS lookups
A DNS lookup is the process through which domain names are translated into IP addresses. This is done internally by sending a request to a DNS server, and that also takes time. I used WebPageTest to check DNS Lookup times for google.com using a simulated mobile device and 4G connection from Dulles, Virginia USA.
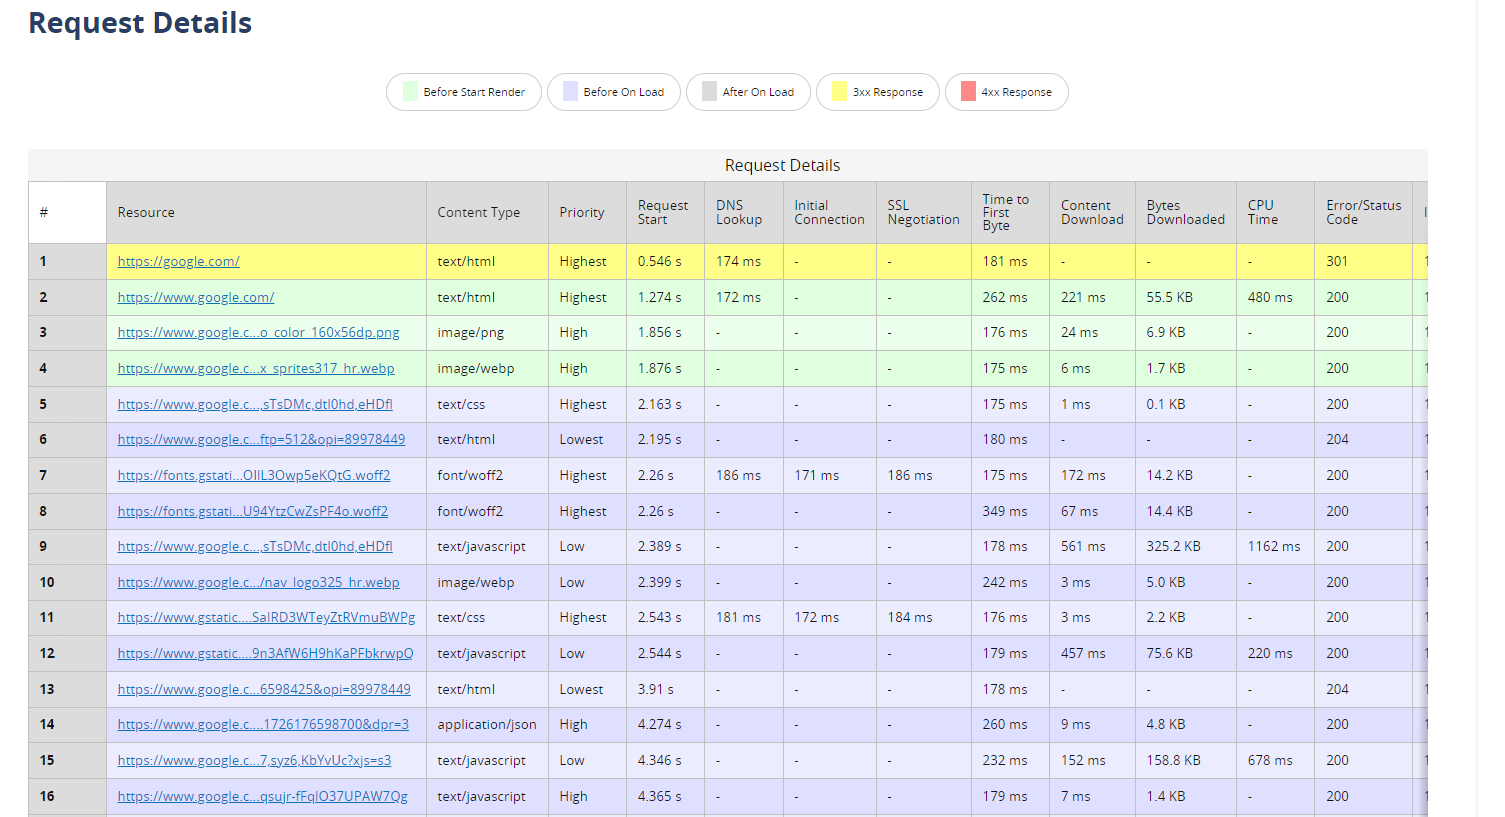 DNS Lookup analysis of google.com using WebPageTest
The “DNS Lookup” column contains the values that we’re looking for. Notice how some of the rows have empty cells in the column — that’s because DNS Lookup responses are cached for the same domain names. You can control this type of caching by setting TTL (Time To Live) values on your DNS panel like this:
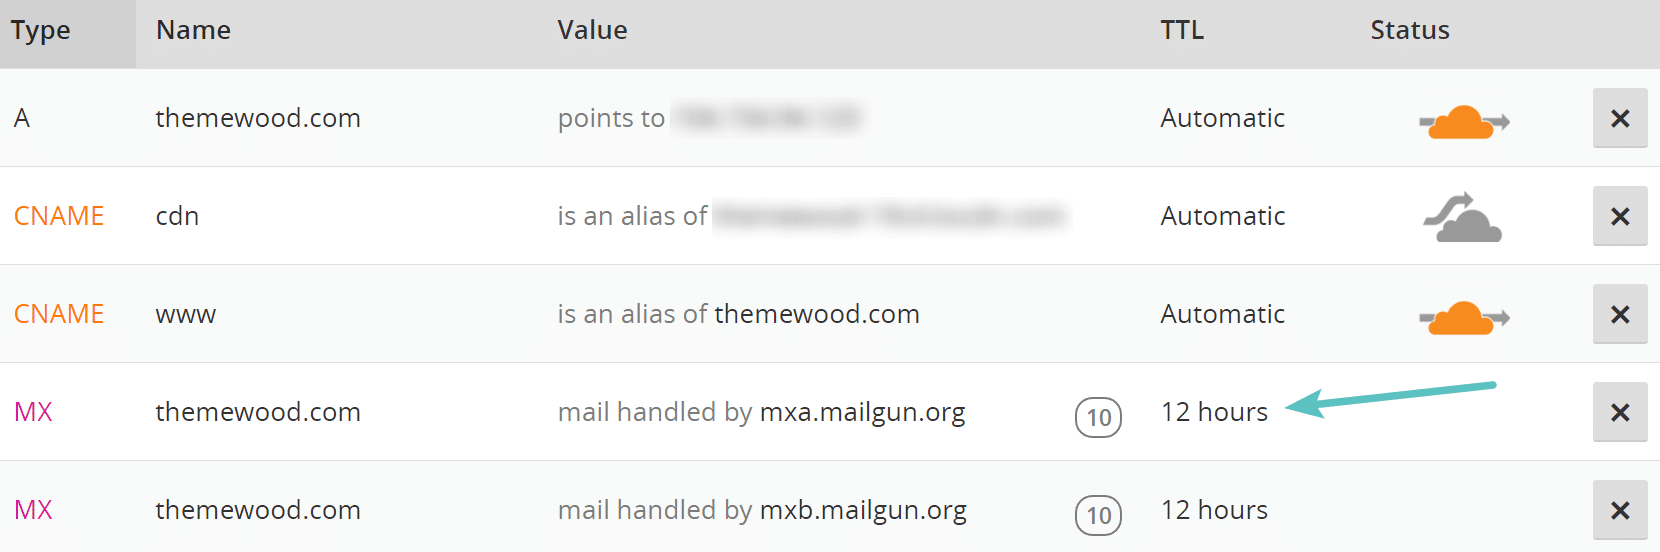 DNS TTL Setting
The following items may help you reduce DNS Lookup contribution to your website’s TTFB:
- If your DNS Lookup times are abnormally high on different tests, consider using premium DNS providers that have DNS resolution times and a widespread network of servers.
- Check where static website assets, such as fonts and images are loaded from. If you use CDN, consider moving as many assets to a single CDN provider as possible to reduce the number of DNS Lookup requests.
- Make sure you have proper TTL values set for DNS Cache. This way, browsers and ISPs won’t have to make a lookup every time they stumble upon a domain name that has been already requested.
Improving TTFB: connection time, handshakes, and TLS
Once a browser knows the server’s IP address, it attempts to reach the server. Usually, It’s done by establishing a connection via TCP and then securing it with TLS. This is done under the hood, and diving into the deep details is not within the scope of this article.
But here’s what you need to know to understand the basic principles, taking TCP protocol as an example:
A handshake in computing is a process of sending acknowledgment/sync requests to another party to establish a connection. In TCP protocol that classically acts as a transport layer for HTTP, a connection is established via a three-way handshake:
- A client sends a SYN (synchronization) packet to let the server know about its intentions to establish a connection
- The server recognizes the packet and sends SYN/ACK (Synchronization/Acknowledgement) packet back, confirming the receipt of the first packet and agreeing to establish a connection
- A client sends an ACK packet, acknowledging the synchronization. After this, the connection is established and ready to transmit the payload.
TCP ensures the correct order of packets and resends any packets that were not confirmed to be received on the other end.
Once the connection is established, TLS (Transport Layer Security) protocol is used to secure the connection. Simply put, the connection is also established in the form of handshakes but using different data.
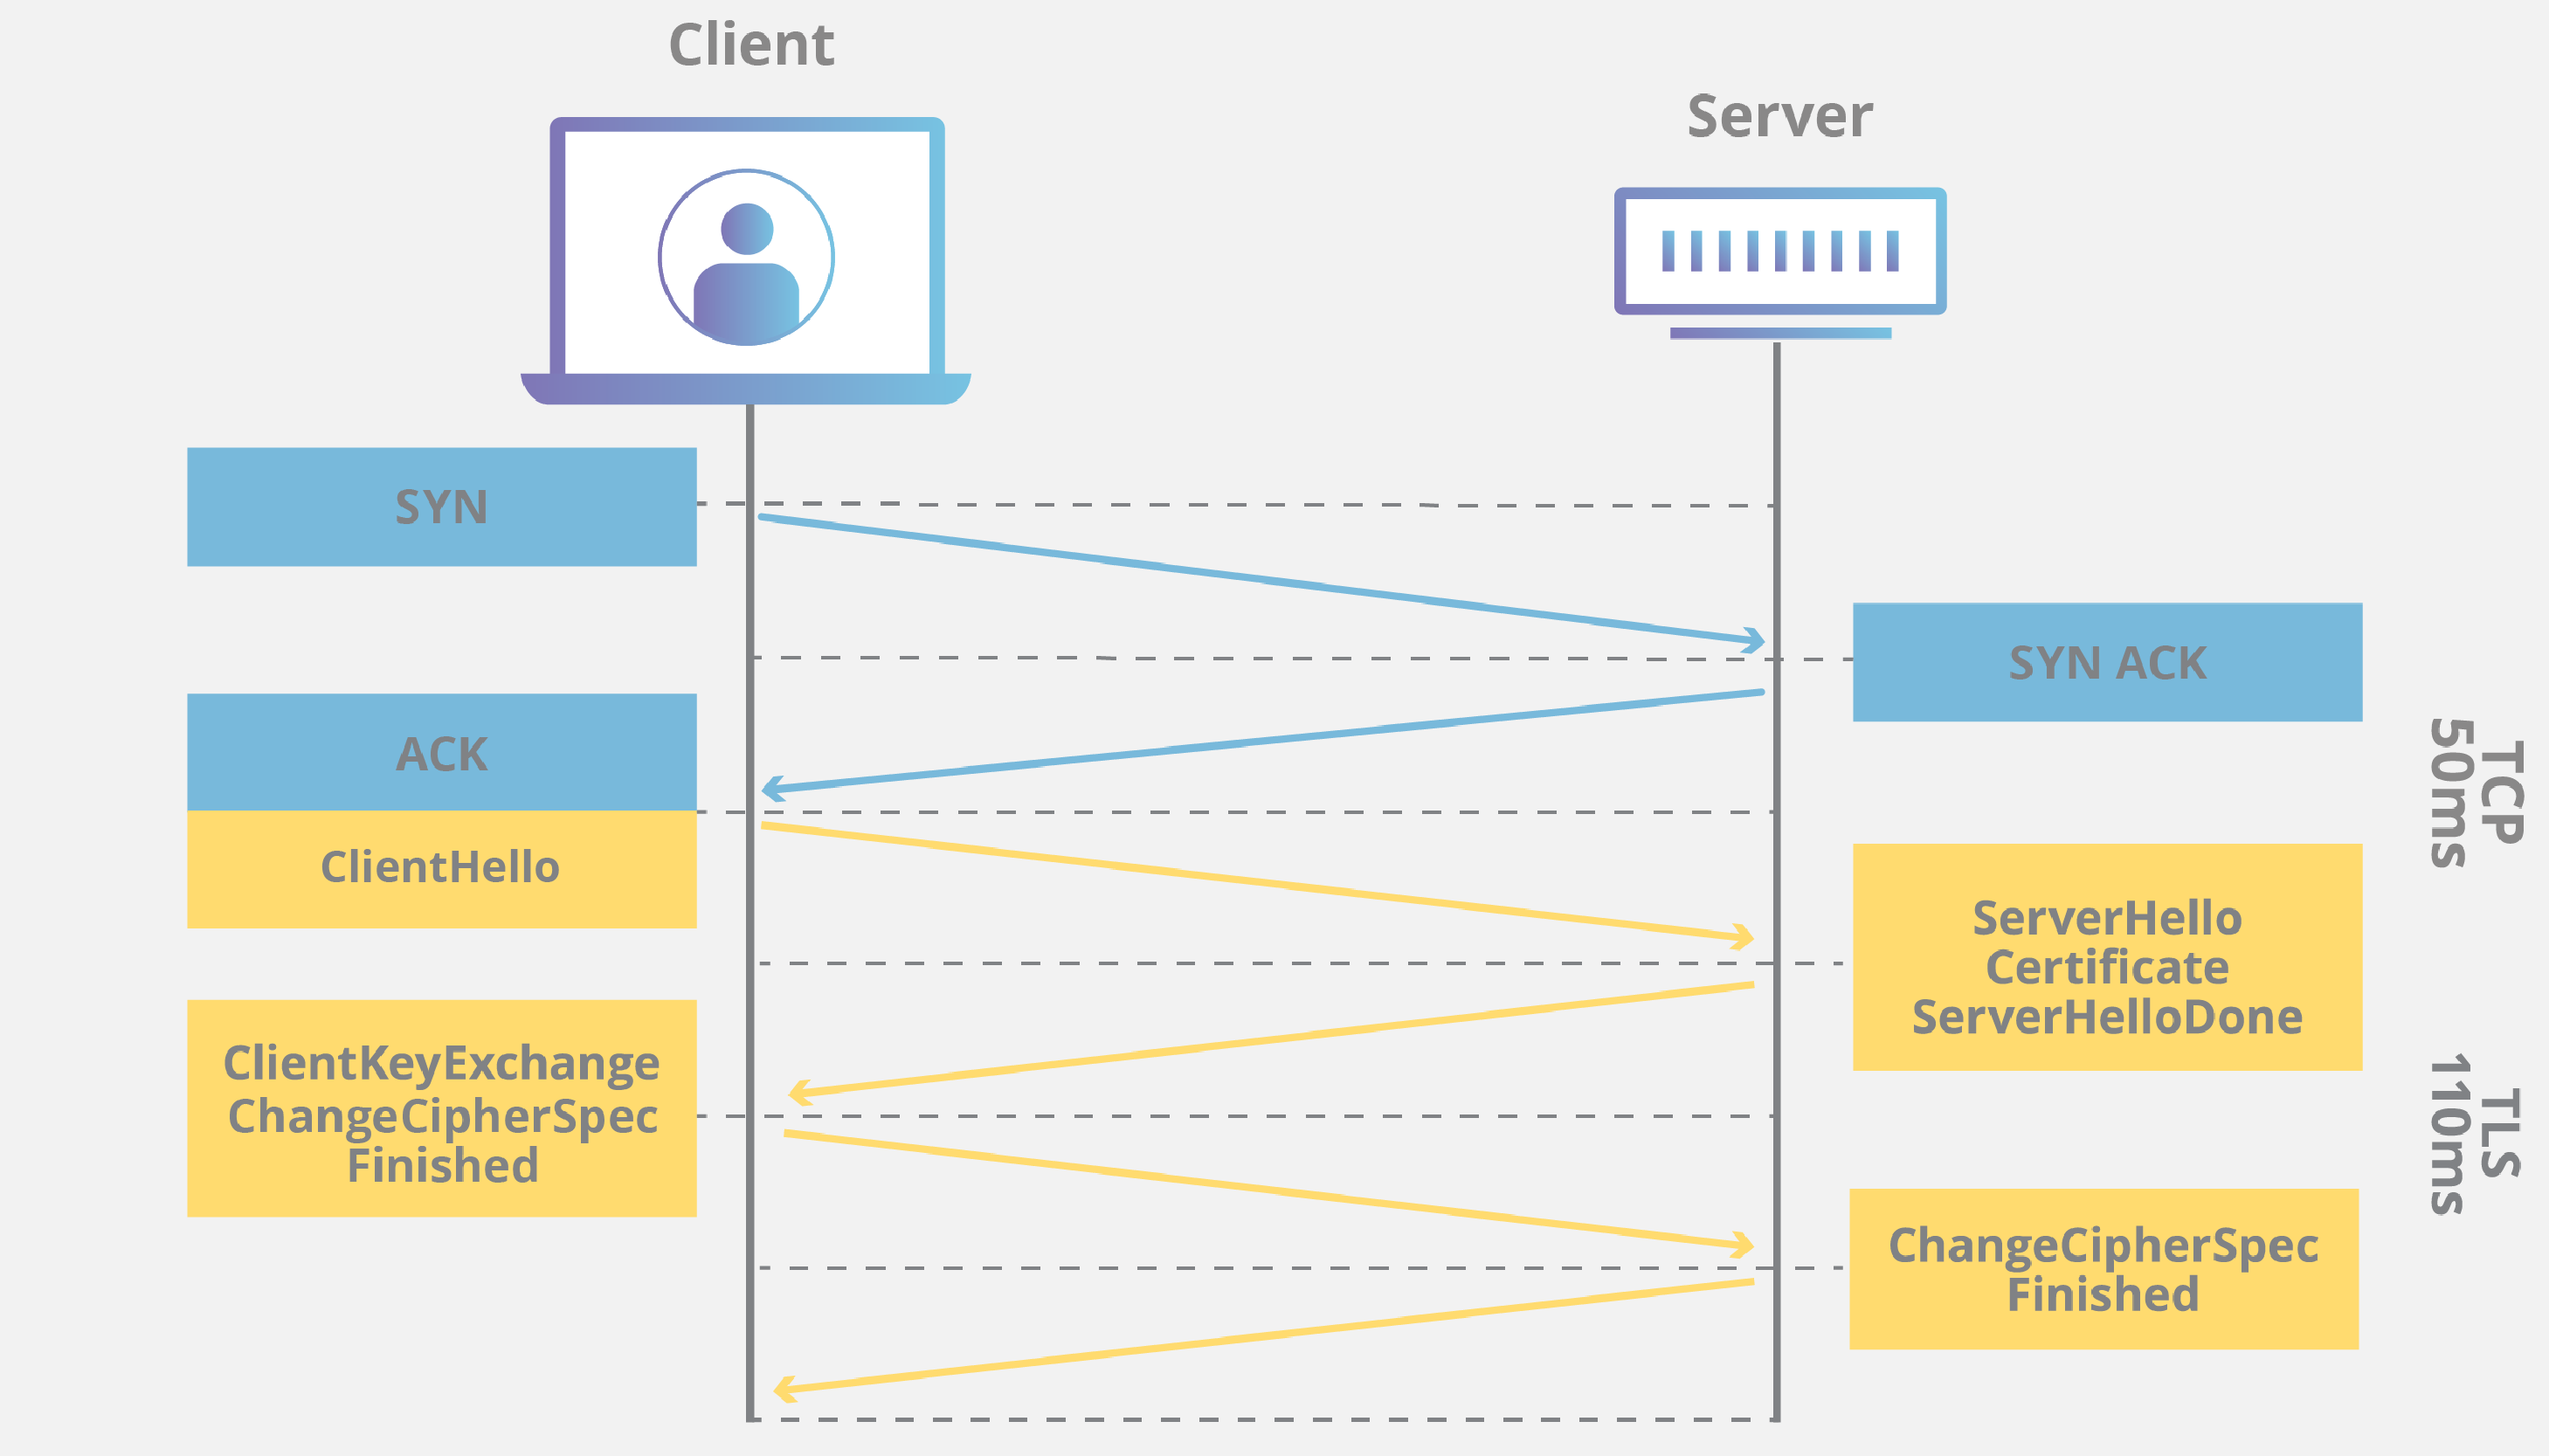 Three-way TCP handshake + TLS Handshakes illustration
In total, connection participants need to bounce 6 packets back and forth to establish a connection that is ready to be used safely. While we’re bound to use what technology offers us, here are the things that may help you establishing a connection faster:
- Use HTTP/3 if possible. HTTP/3 runs on QUIC protocol instead of TCP. The protocol is faster due to the reduced amount of handshakes and also includes TLS 1.3 with fewer handshakes and more security.
- Enable 0-RTT Connection Resumption, a feature of TLS 1.3 that allows resuming a connection without sending the same data again.
- Use TCP Fast Open. If switching to the newer protocol is not an option for you, this TCP protocol extension would allow chunks of payload to be sent with the initial SYN packet.
- Consider using TLS False Start. This feature allows data to be sent right after one of the parties authenticated their identity but did not receive the confirmation on the other end.
Improving TTFB: Server processing time
This portion of the request flow is where back-end improvements take place. Whereas other optimizations in this article are more inclined toward the server’s communication with outer networks, this step is focused on the internals of your back-end stack.
The amount of possible bottlenecks that delay the first byte may vary based on the technologies used in your application, but the common ones are:
- Database queries
- Disk operations
- Server-Side Rendering, for SPAs
- Cache hits/misses
Server-Timing
response header can be used in a web application to measure the time it takes to perform certain actions and pass those values to a web client,
displaying those later via DevTools or Javascript.
For example, measuring database query time would look like this in PHP:
<?php
// Get a high-resolution timestamp before
// the database query is performed:
$dbReadStartTime = hrtime(true);

// Perform a database query and get results...
// ...

// Get a high-resolution timestamp after
// the database query is performed:
$dbReadEndTime = hrtime(true);

// Get the total time, converting nanoseconds to
// milliseconds (or whatever granularity you need):
$dbReadTotalTime = ($dbReadEndTime - $dbReadStartTime) / 1e+6;

// Set the Server-Timing header:
header('Server-Timing: db;desc="MySQL time";dur=' . $dbReadTotalTime);
?>
Here’s how data sent via the Server-Timing header is displayed in the DevTools Network tab:
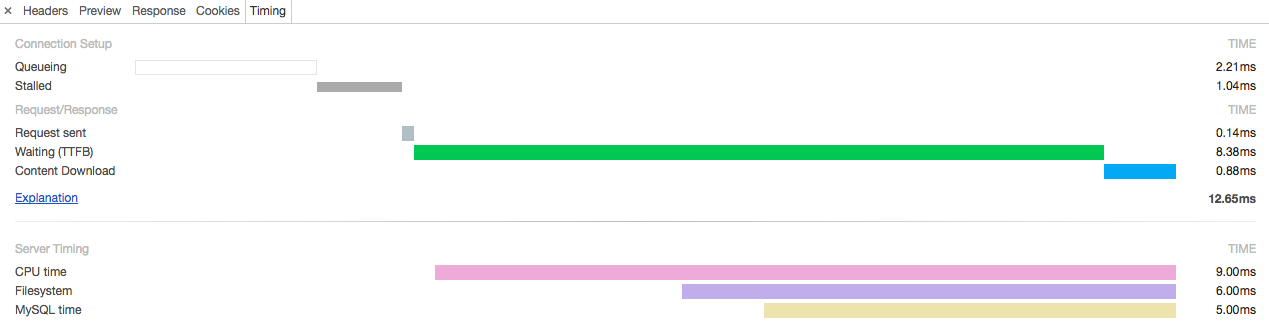 Performance analysis using Server-Timing headers in the DevTools Network tab
When it comes to improving TTFB by optimizing the back-end, there’s no one-size-fits-all solution. Let’s focus on what most approaches have in common.
Improving server processing time: hosting
Checking your hosting capabilities should be at the top of your checklist. It boils down to the traffic your application receives and the dynamic/static content ratio. If you don’t have a lot of things on the website changing frequently and the traffic is from low to moderate, shared hosting should work well. Consider dedicated hosting with advanced resource management for applications that may require scalability.
Improving server processing time: third-party HTTP requests
Sending cross-domain requests from your backend could be very time-consuming compared to other operations done on the back-end. Consider lowering the amount of outgoing HTTP requests from your server to another:
- Caching responses. If the responses don’t vary much, you can try caching the data and storing it on your side. Relevant for data that changes, say, once a day, and that doesn’t depend on a visitor.
- Move requests to the front end. Some back-end methods end up acting just as proxies between the client’s device and third-party service. In this situation, sending an AJAX request from the page itself would be more efficient.
Improving server processing time: caching of different sorts
To reduce server load and increase response times, use caching on different levels.
- Caching for CDN edge servers. Serving non-personalized static assets from CDN servers results in lower TTFB because of physical proximity. Some CDNs specialize in certain content types, like our Image CDN which focuses on images and visual assets.
- Page caching. Utilize server-side caching of frequently accessed content. It is important to maintain balance setting up cache time, otherwise, cache misses might appear often, or users would get stale content.
- Database/Object caching. Used to store results of frequently executed queries.
Improving TTFB: an example
I didn’t want this article to be purely theoretical. So here is an example for us to look at.
I do web development freelance. From time to time I get requests to improve website performance. Sometimes these requests look like “need to make the website faster, it takes forever to load”. And by “forever” I mean websites that tend to load for 10-20 seconds. Usually, these are WordPress e-commerce stores.
We’ll be working with a demo website with the following specs:
- Local WAMP stack
- CMS: WordPress
- eCommerce engine: Woocommerce
- Codebase: hook-based code interceptions for custom functionality
- Lots of (pseudo)-dynamic content
- Recent changes: custom code for changing prices based on the visitor country
Let’s take a look at what the website and its TTFB looks like:
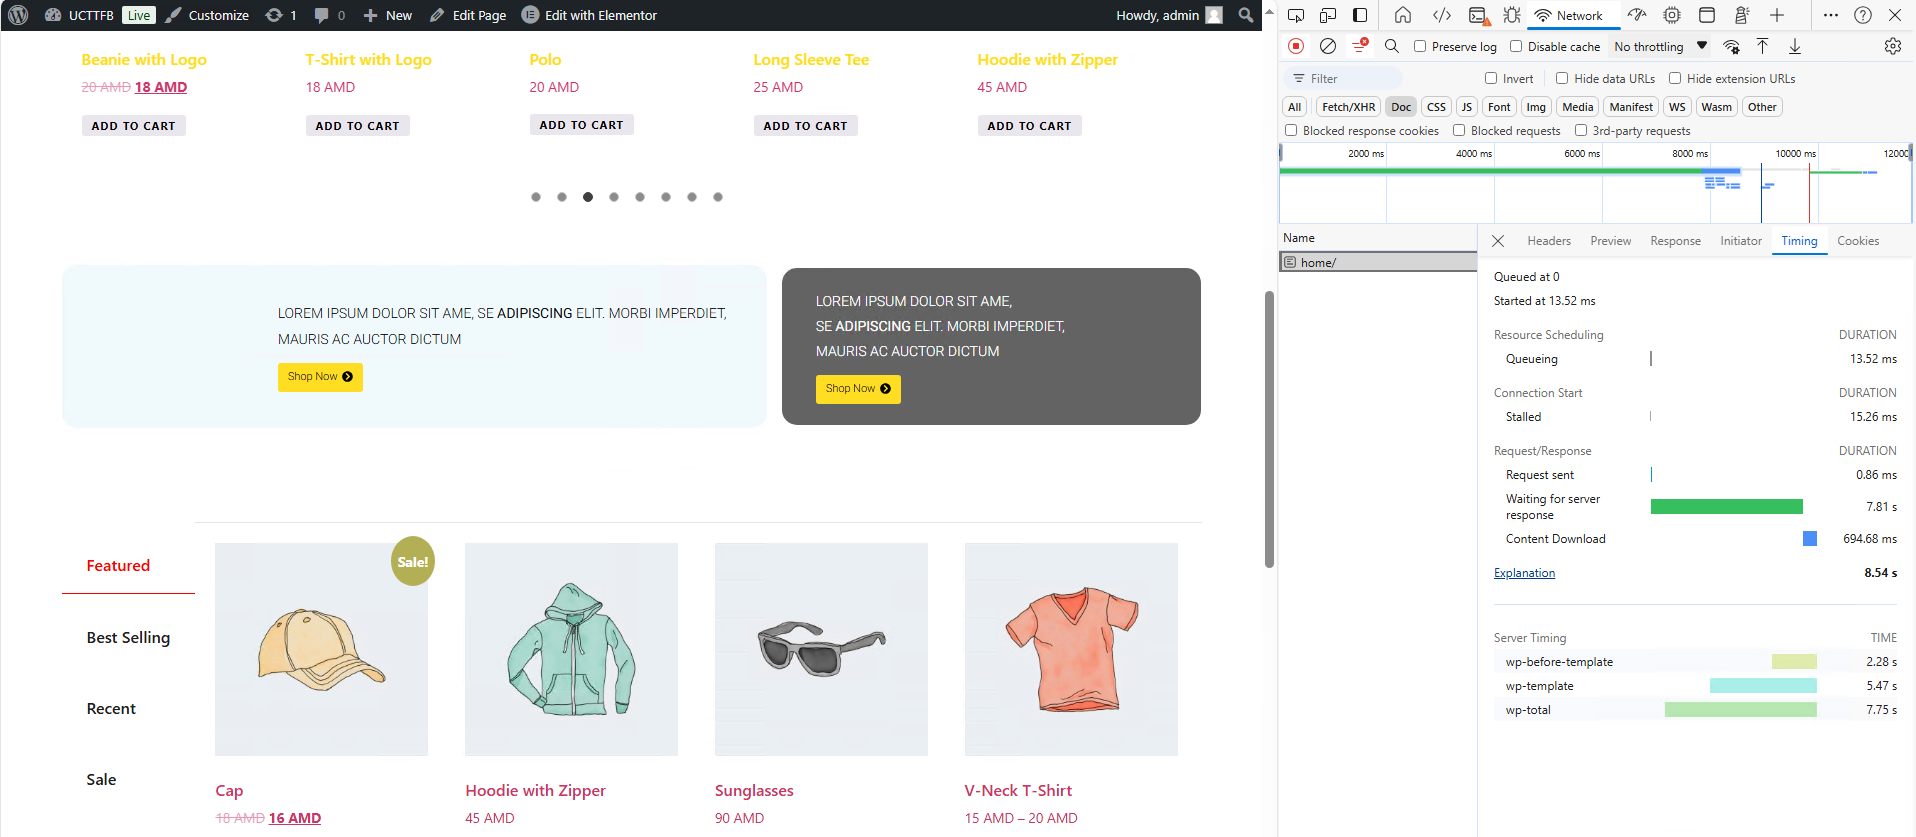
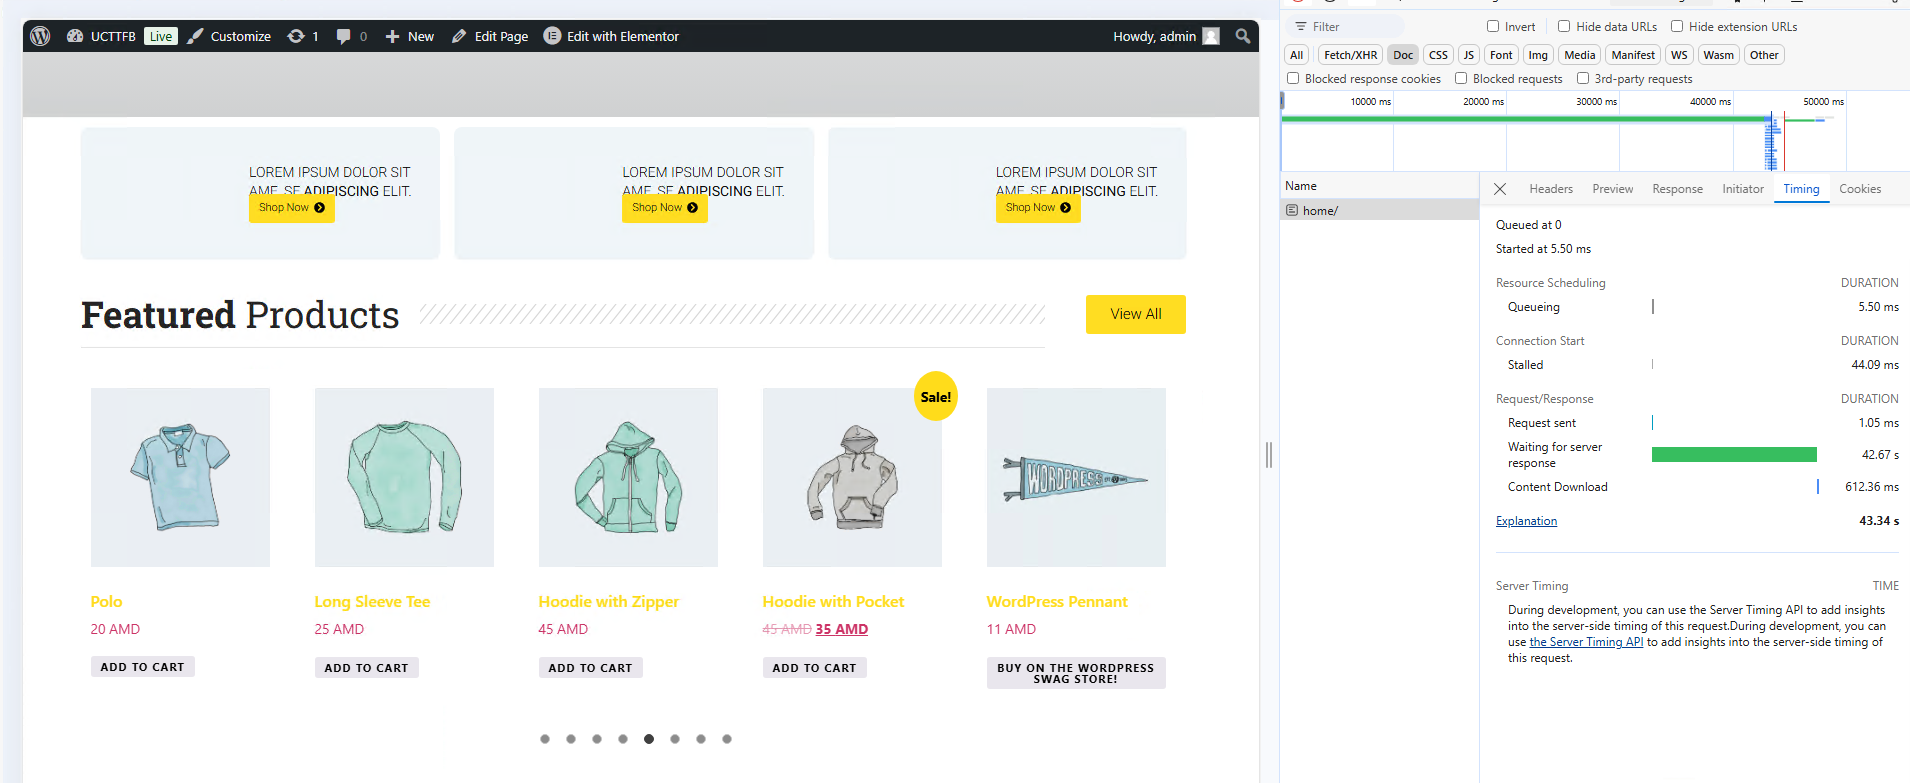 WordPress + WooCommerce website with poor TTFB
Right off the bat, it seems that it is a server response issue. When working with WordPress, anything that contains custom code is usually the first to blame, e.g. plugins and themes. Usually, testing starts with disabling those consequentially. But to preserve functionality, let’s utilize Server Timing API.
WordPress has an official Performance Lab plugin that includes some basic Server Timing benchmarking. In a nutshell, based on its predefined metrics it is possible to tell if the problem lies either before the template (meaning plugins are to blame) or within the template (most commonly it is custom code in functions.php, whatever form it takes).
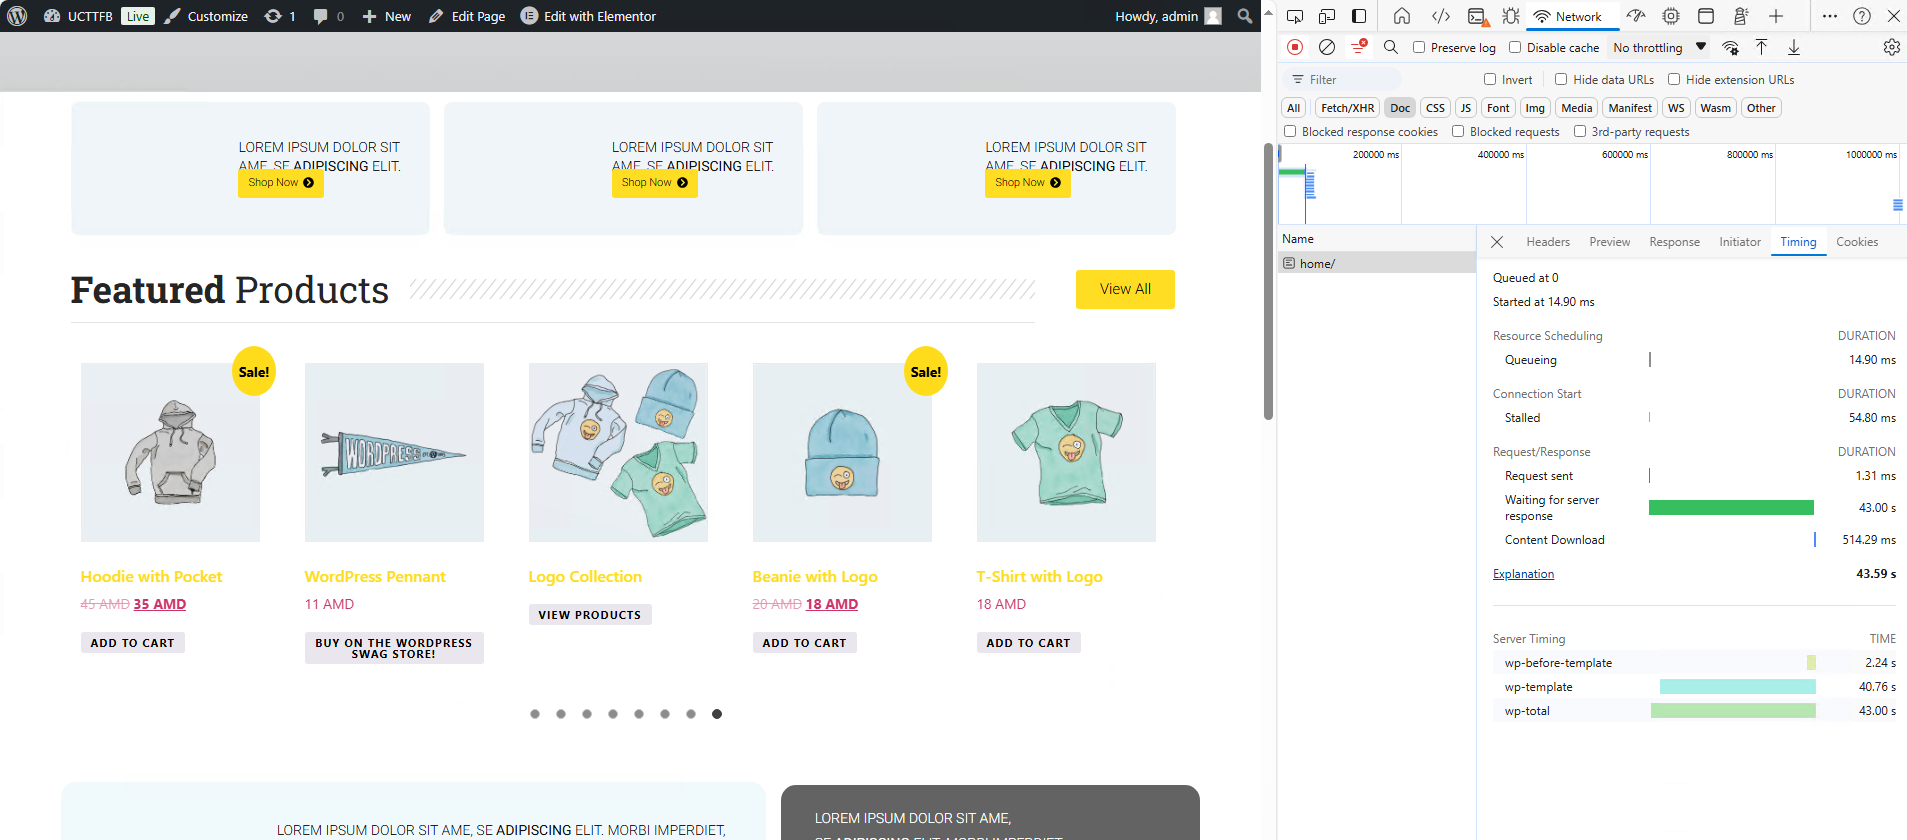 WordPress with Server Timing API using Performance Lab plugin
The “wp-before-template” doesn’t look abnormal. It is the “wp-template” that causes most of the wait.
Based on the fact that there was an attempt to change prices programmatically. WordPress hooks have fairly verbose namings, so let’s look for the word “price” in the template folder.
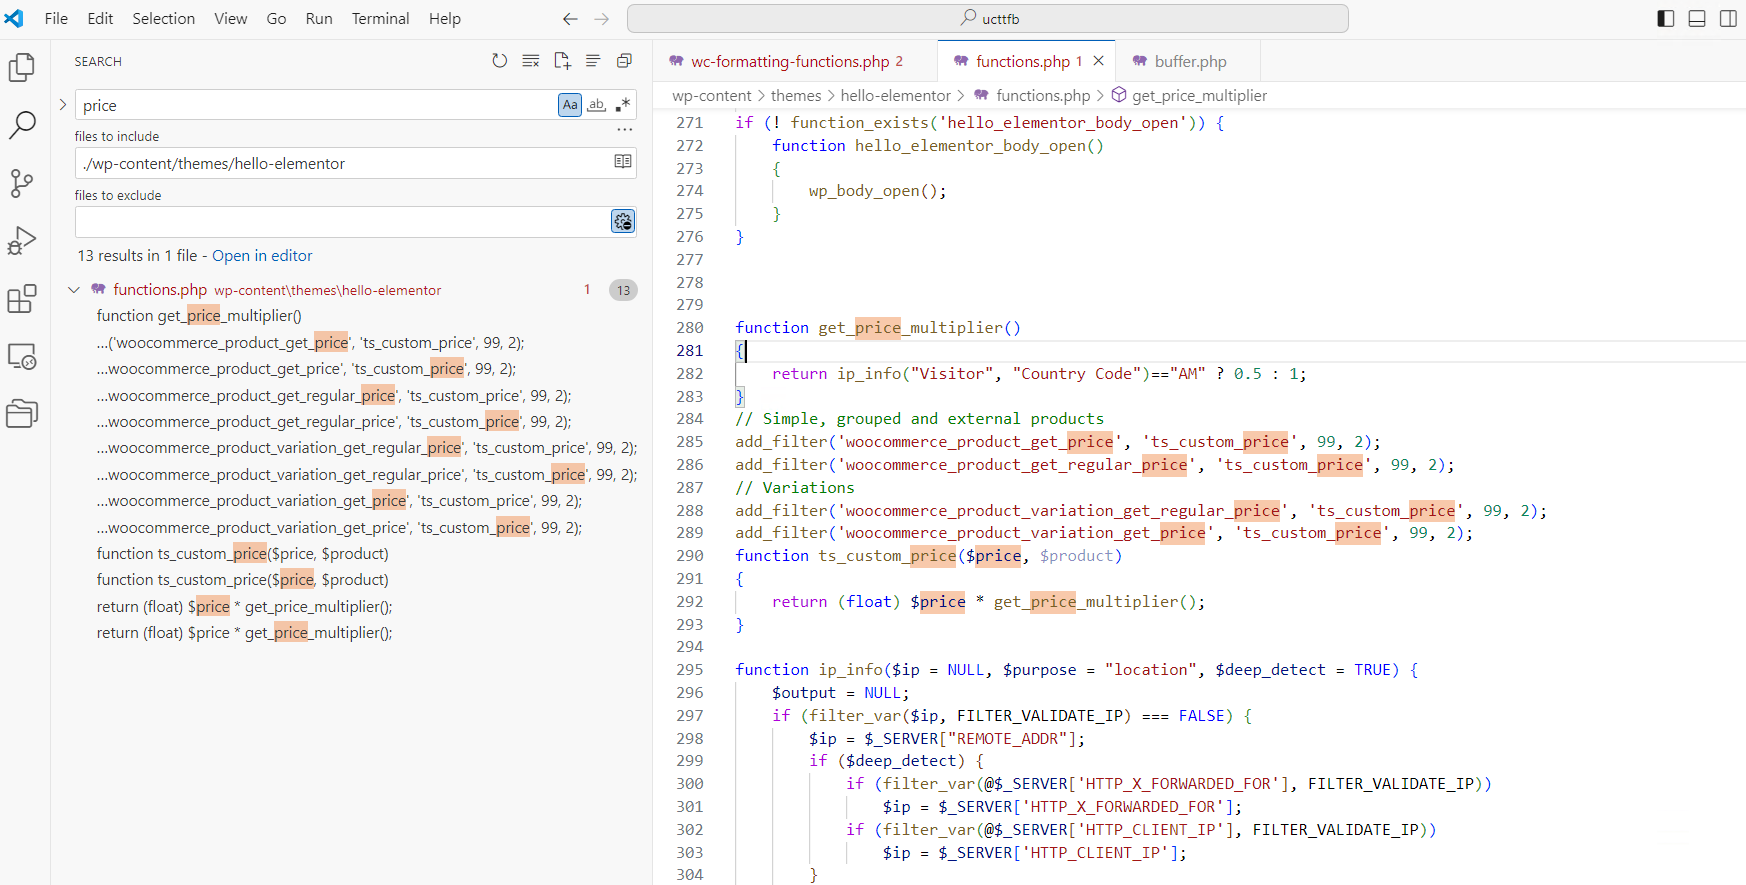 WooCommerce Price Hooks in functions.php
We see a bunch of price-related WooCommerce hooks with the same ts_custom_price function attached to them.
Based on the code, this function multiplies product price by a certain number that is conditionally calculated by get_price_multiplier.
At this point, it becomes clear where this thing is heading. On line 282, the ip_info function is called. Let’s see the listing of the function:
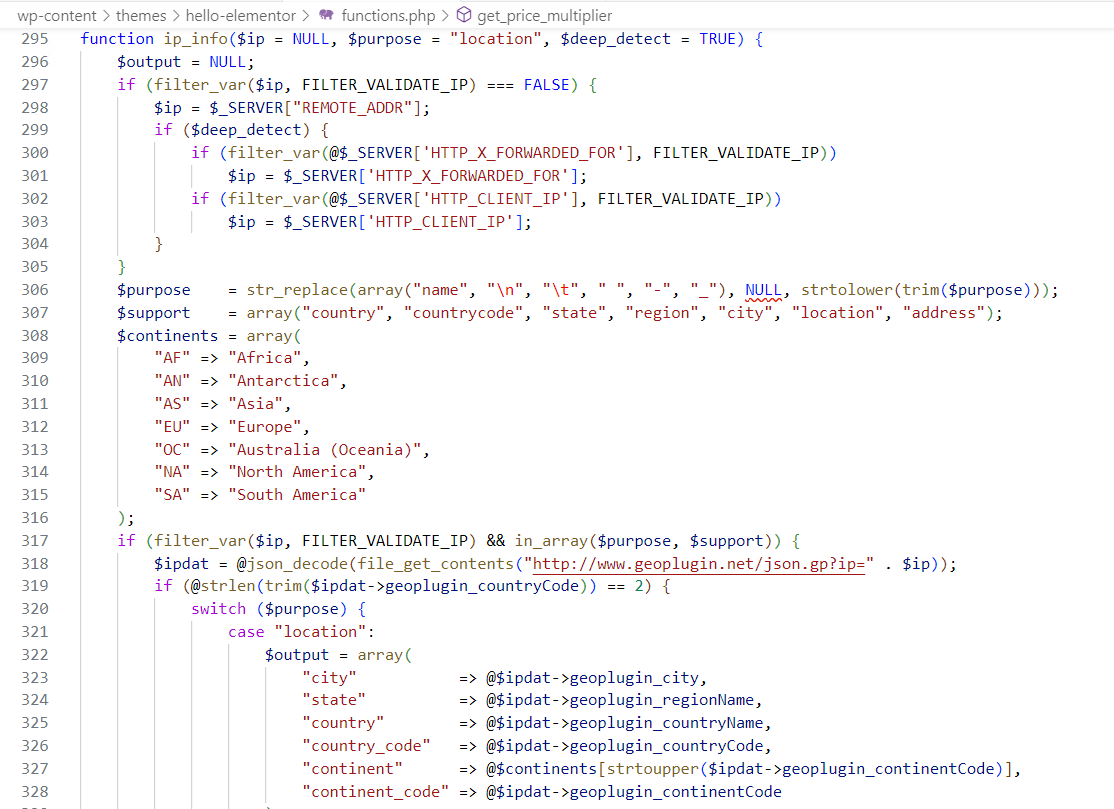 A function that gets location by IP address by sending an HTTP request
The key is on the line 318. The function sends an HTTP request to geoplugin.net to get the visitor country based on the IP address. Synchronously waiting for HTTP responses on the back end is a very costly operation time-wise. And the request is being sent at least for each price rendered on the home page, which has lots of products.
Fixing the underlying issue
We could just remove the functionality, but what if we need to keep this feature? If we can’t get rid of the request to the remote service completely, let’s reduce the count of remote calls.
Visitor country won’t change while waiting for the inbound request to be processed, so let’s just get the country code beforehand once, use it within the multiplier function and see where it gets us.
 Woocommerce TTFB optimized
We got about 5x improvement keeping the functionality intact. This value is still considered big, but remember that we’re running locally without any optimizations.
Fixing the underlying issue
When describing the setup, I mentioned that the website has pseudo-static content. It is possible to change content through CMS but unless it is changed again it remains static. Maybe we should just cache it?
One of the common ways of caching WordPress sites besides using edge CDNs is to install caching plugins. Most of them have advanced features, but the core one — precaching dynamically generated content into static HTML files. So instead of fetching content from a database and running PHP to get all the same data, the server just returns a precompiled HTML file. I used the WP Fastest Cache plugin.
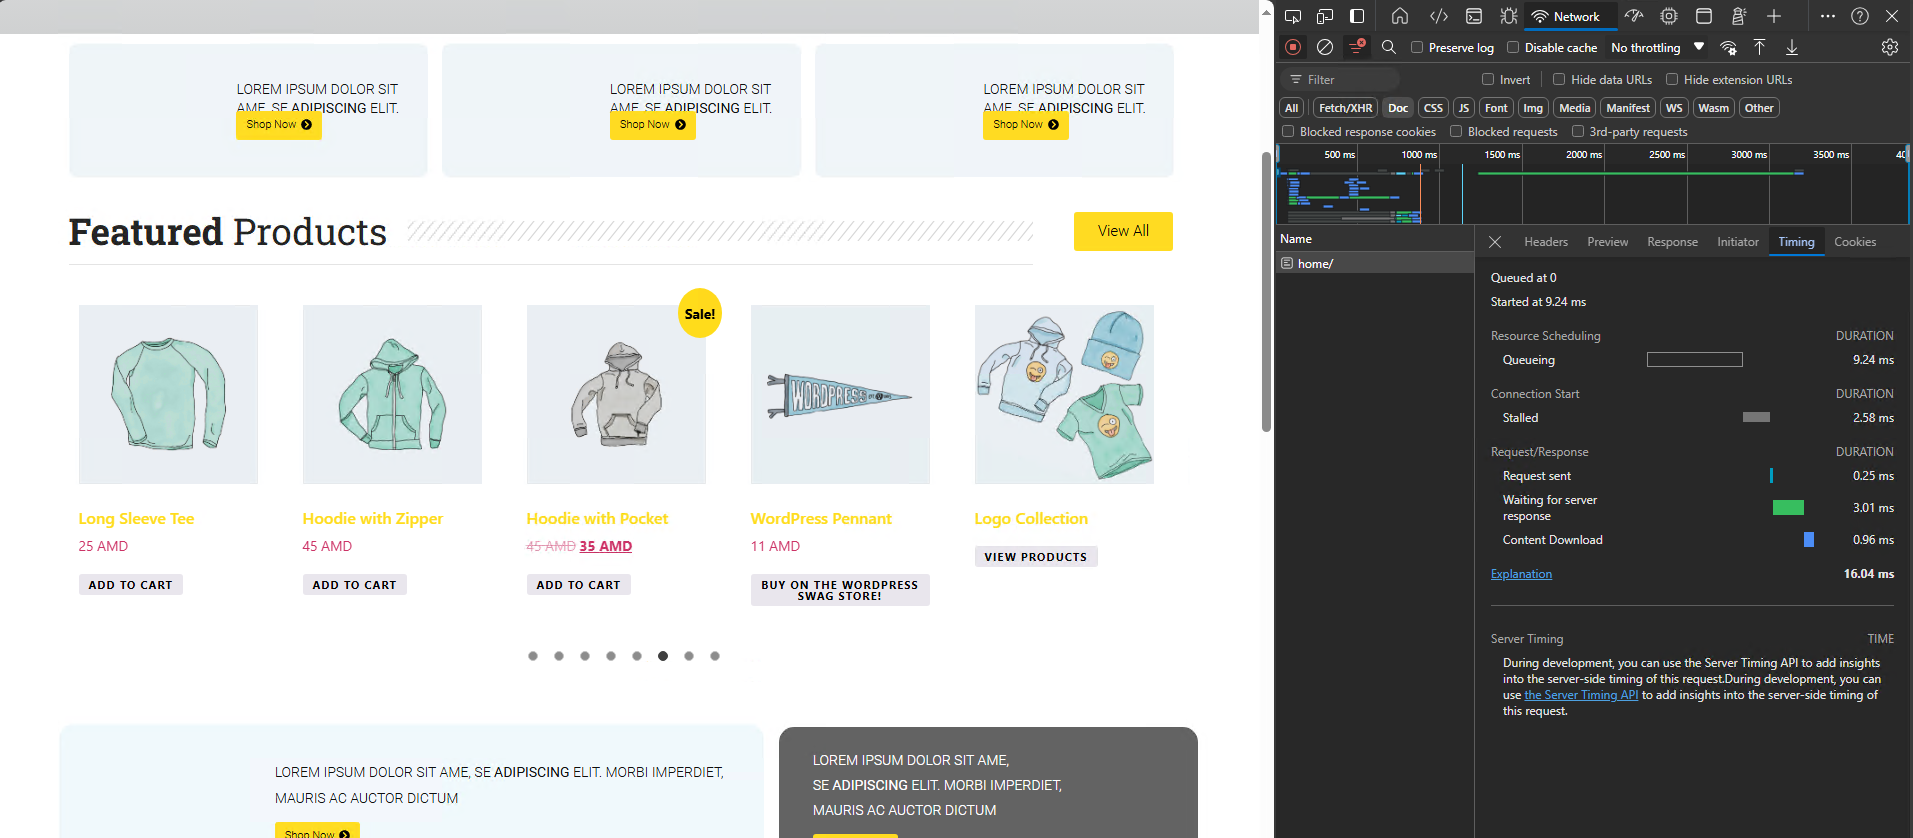 Low TTFB due to caching
We get 3.01 milliseconds instead of 8 seconds we had previously. I used caching here for demonstration purposes. Although such drastic improvement pleases the eye, you should avoid caching user-specific data like geolocation response in this case.
We’ve gone far enough. Let’s conclude the example at this point.
Conclusion
The goal of this article was to give the reader an overview of the Time To First Byte metric, and not to give an impression of it as a standalone metric. TTFB is a preceding factor for Core Web Vitals metrics that monitor optimizations for the end user, and not for just numbers. I recommend making improvements to your web apps with this idea in mind.