In our previous article, we talked about Google Lighthouse and its performance metrics. This time, we’ll discuss First Contentful Paint (FCP), which is one of the core Lighthouse metrics, since it’s important for measuring the speed of your website as psychologically perceived by your visitors.
What does “contentful” mean?
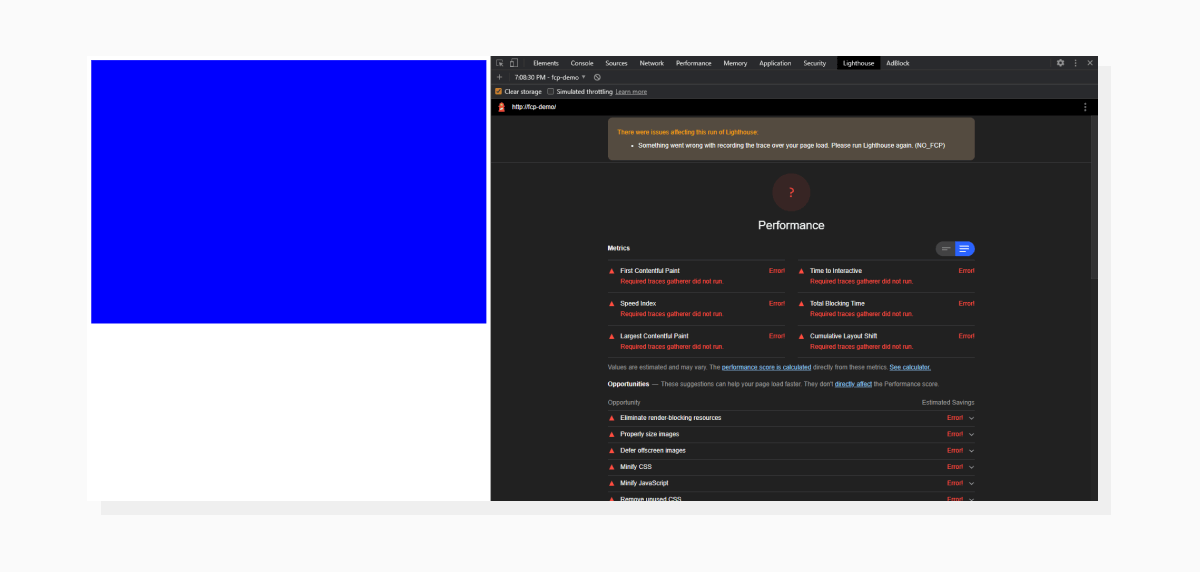
To start with, we can think about “First Paint” as the time it takes to render anything on the page. Example: an empty page with a non-white background. That’s technically a “paint,” but it doesn’t provide any meaningful user-centric information.
That’s why the word “contentful” is important here. FCP shows how much time it takes to render a “human-perceived” DOM element. This could be either an image, text block or non-white <canvas> element on the page.
Let’s see this in action with Lighthouse. We’ll start with just a page without any content:
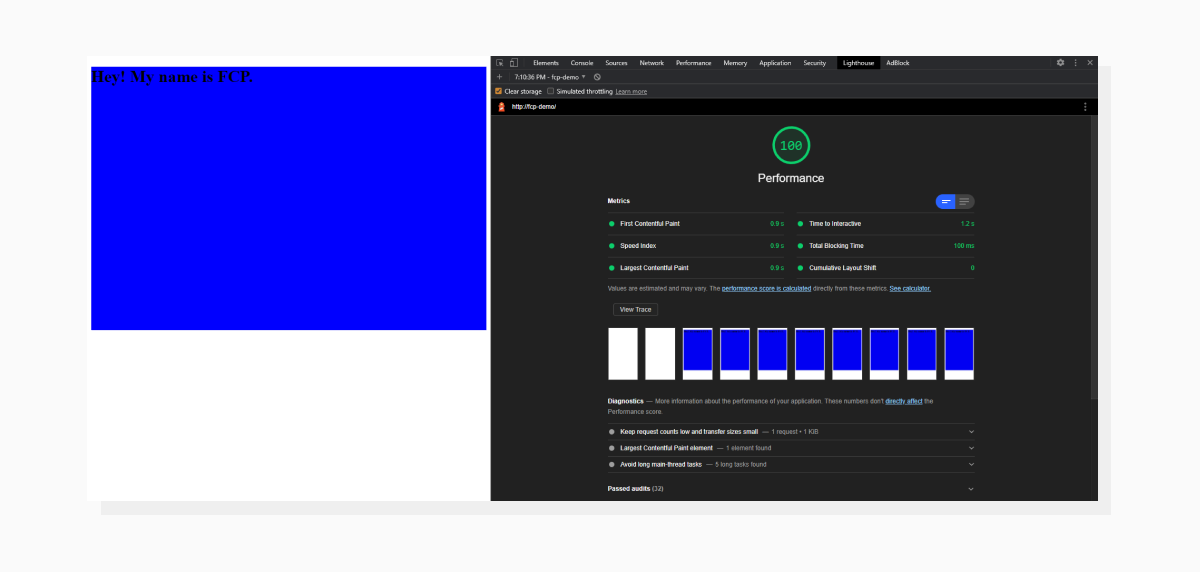
Now, let’s add a bit of text to satisfy the definition of an FCP:
FCP’s impact on total score
The First Contentful Paint takes up 15% of the overall score. Here’s an interactive tool that demonstrates how the score fluctuates based on individual metrics. The importance of this metric lies somewhere between Cumulative Layout Shift (5% impact) and Largest Contentful Paint and Total Blocking Time, both responsible for 25% of the total score.
But, thinking of FCP as of an indicator of page loading progress to a visitor, I tend to think (and observe when working with real websites) that it also plays an important role when subjectively evaluating your page load times.
What affects First Contentful Paint?
Our tiny fragment of text got an excellent score, of course, but on a real website, the FCP doesn’t happen right away. The time it takes to render the first piece of content is a result of all the previous actions made by the browser. Hence, improving the metric is a matter of optimizing all the steps that happen before it.
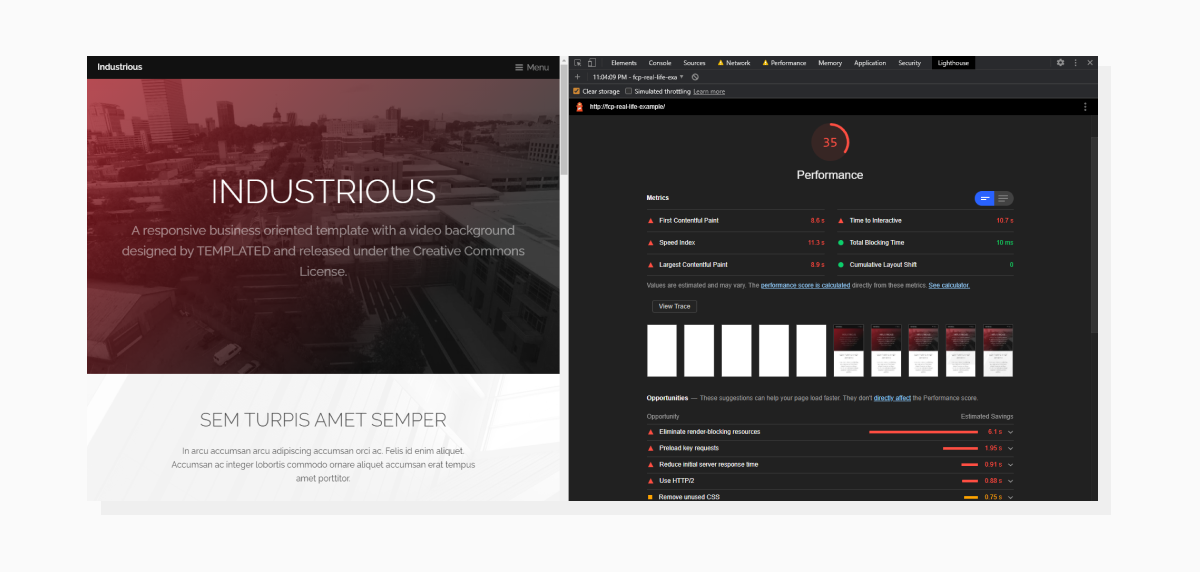
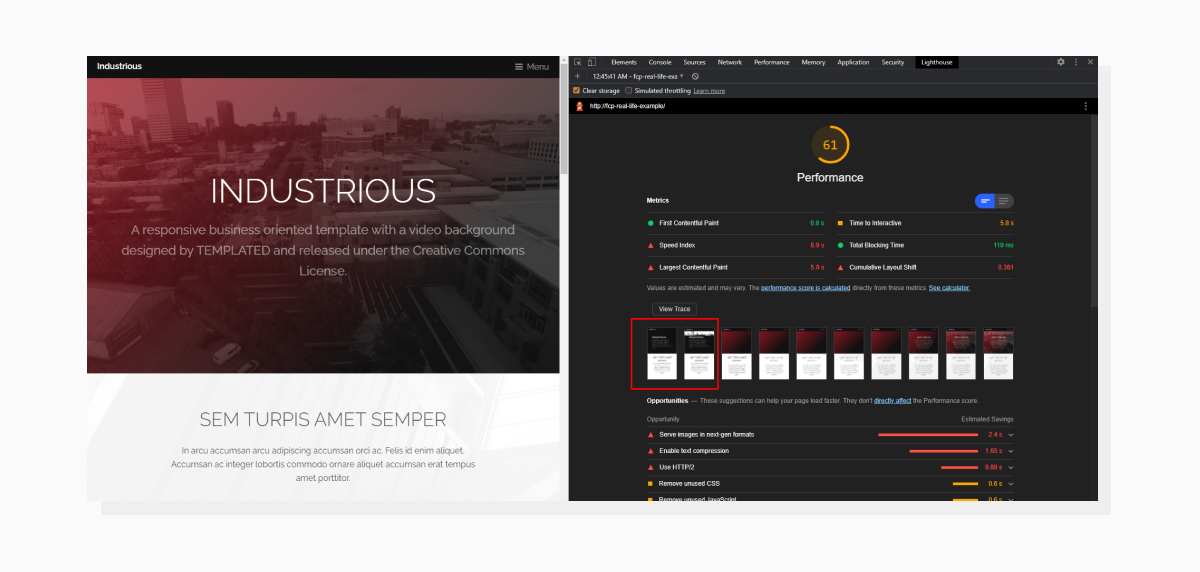
For this article, I prepared a demo that will serve as a decent example of a real-life situation. I used the Industrious template by TEMPLATED (Creative Commons License) and tweaked it to represent the page loading process in a demonstrative way.
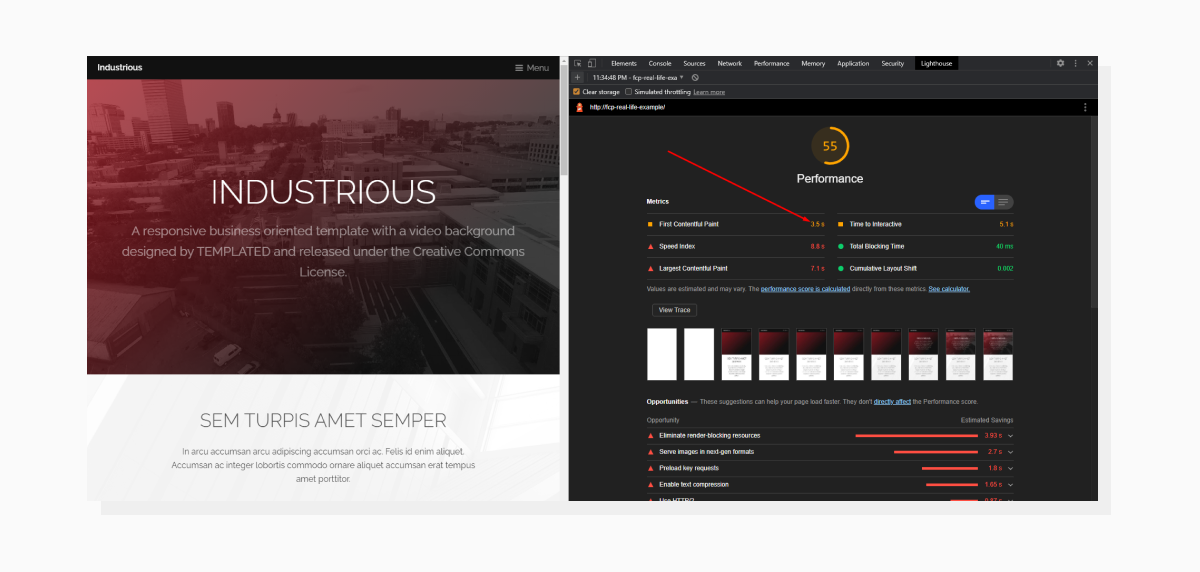
Let’s take a look at the template and its Lighthouse results (all audits will be done with the Mobile setting):
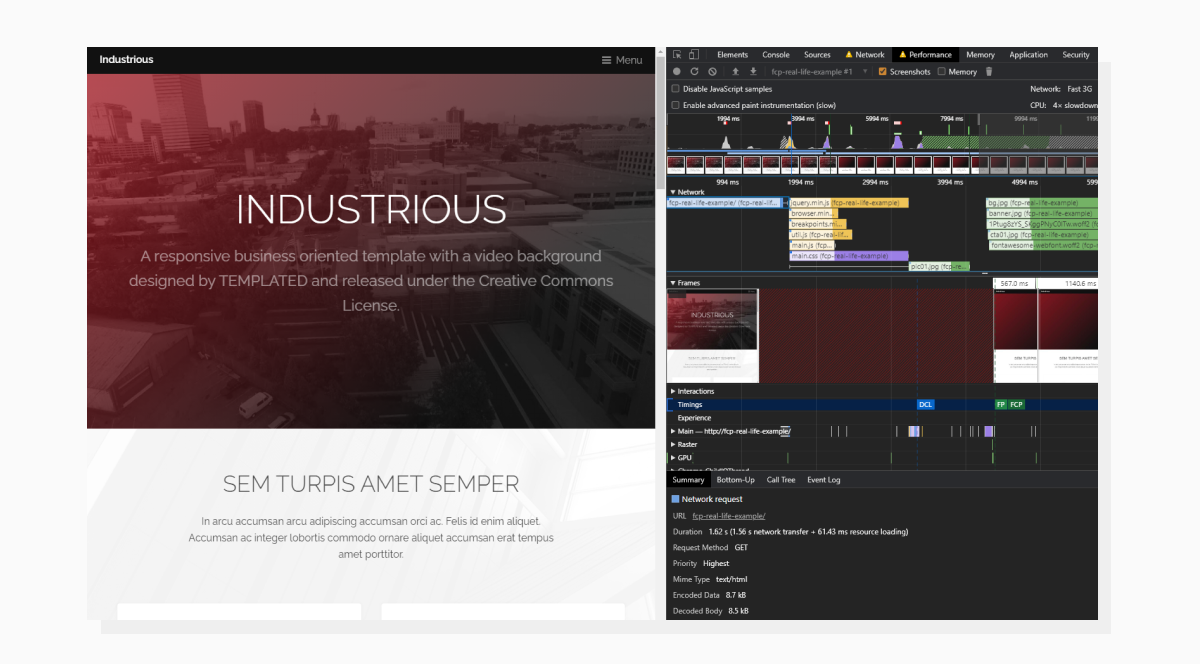
Now, let’s open a new tab and load the page again with the Performance tab in DevTools activated. Please note that we’re loading the page with both CPU and Network throttling to simulate real-life conditions:
In the Timing section, you can see that the FCP event happens at around the 4380ms timestamp. Notice that Lighthouse has a different value for FCP (8.6s to be exact). This is because Lighthouse and DevTools might be using different Network and Throttling settings.
The Performance tab demonstrates events in chronological order. Some blocking events that happen during the page load can affect our First Contentful Paint time. Let’s see how we can optimize the performance.
How to speed up First Contentful Paint
As mentioned before, we would need to optimize events that happen before the FCP to get better results. What happens when we put in a website address and press Enter? A request is sent. So let’s start with that.
Time To First Byte (TTFB)
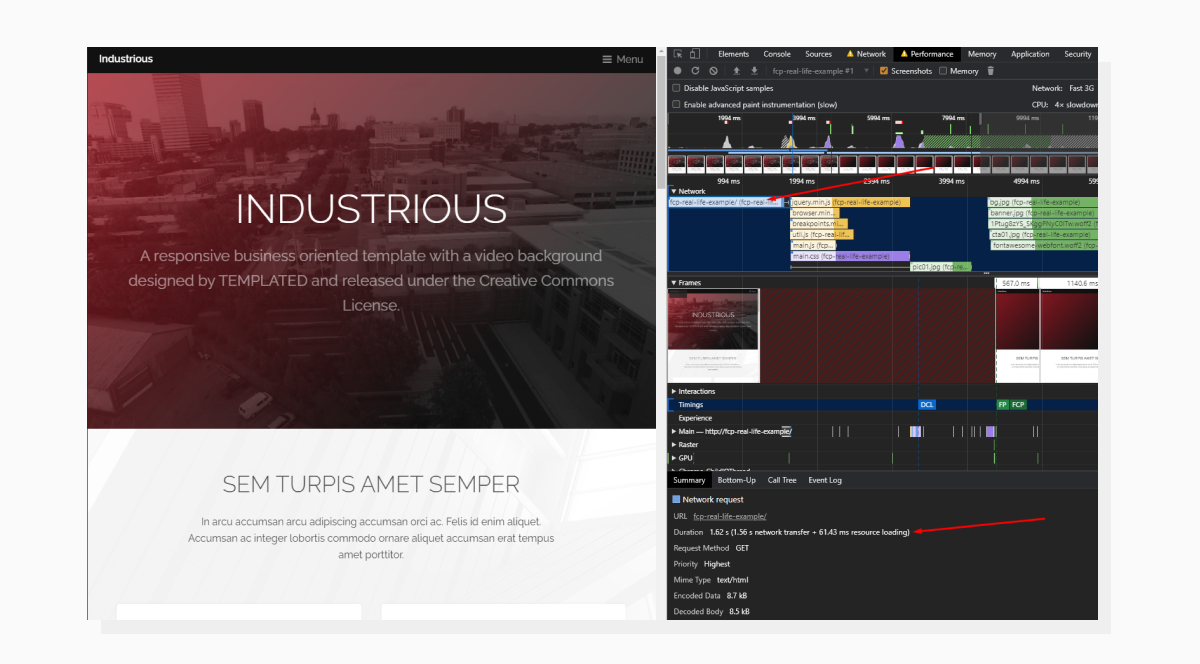
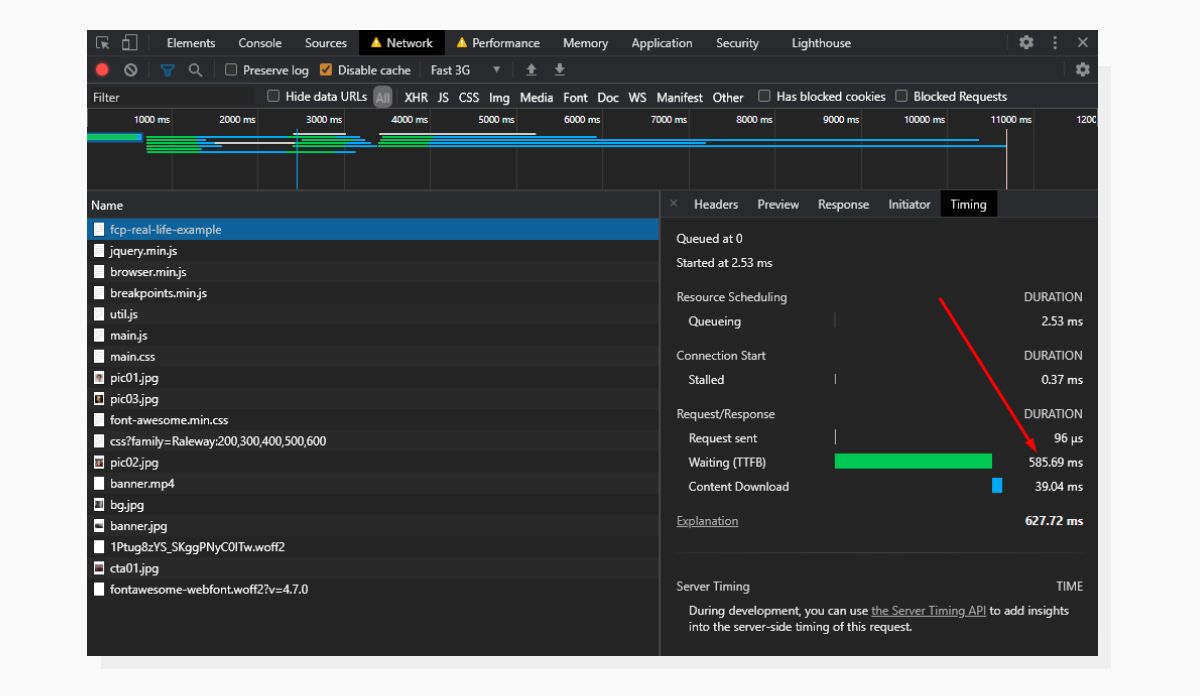
This is how long it takes to get the first piece of data from the server after we open a website. This parameter affects not only the FCP metric, but also all the events which occur afterwards. In the previous screenshot (Performance tab) in the Network dropdown, we can click on the first request and check how long it takes to hear back from the server.
Let’s decipher this. Sending the request and getting back a complete HTML response took 1.62 s (1.56 s network transfer + 61.43 ms resource loading).
These 1.56 seconds include:
- Allocating resources for the request
- Sending the request
- Waiting for the server to send the first byte of data back
- Downloading the whole response
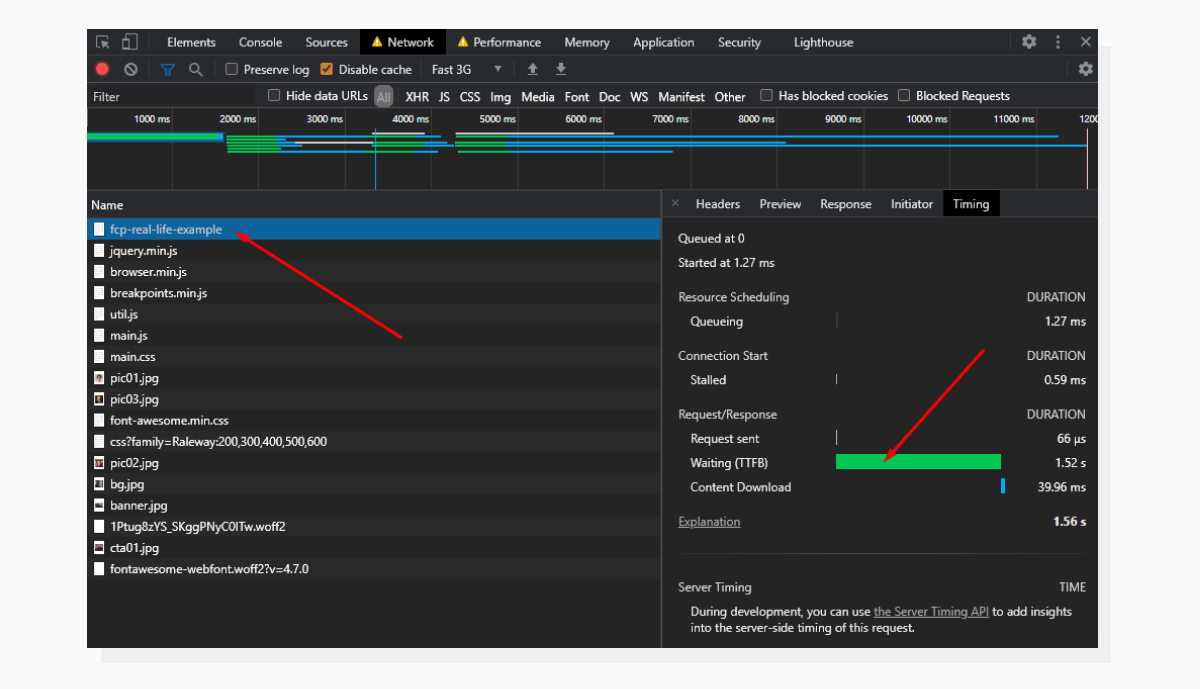
While items #1, #2, and #4 are more beyond our control, item #3 (Time to First Byte) would be our primary interest on this step.
To get detailed info about the request, let’s switch to the Network tab and expand the info about the request:
Here we see that the lion’s share of the time is dedicated to Waiting. This is another name for Time to First Byte.
Now it’s time to look into what happens on the server and check if we can get some improvement.
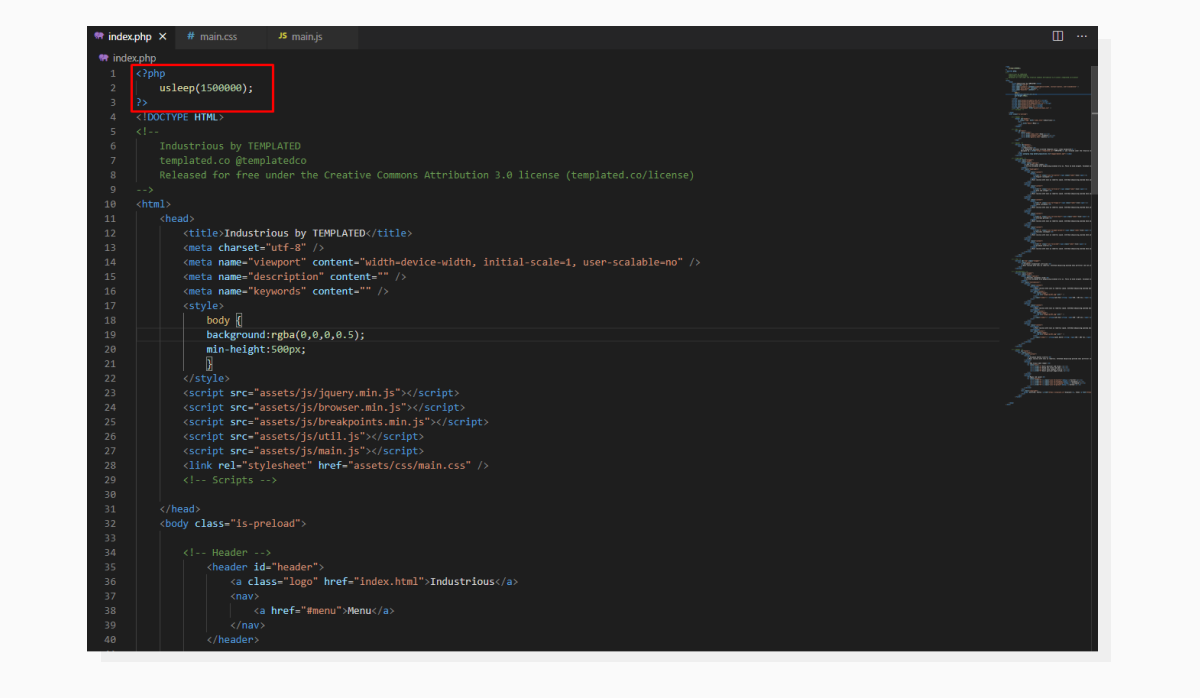
All that happens before <!DOCTYPE HTML> could potentially affect TTFB. For illustration purposes, I intentionally delayed code execution by 1,500 milliseconds. Once this time period has passed, the HTML gets sent to the frontend.
In real life, these abstract 1.5 seconds would be taken up by all the prerequisite work such as selecting a template to render, getting values from a database, sending HTTP requests to third-party resources — all of which you would want to optimize.
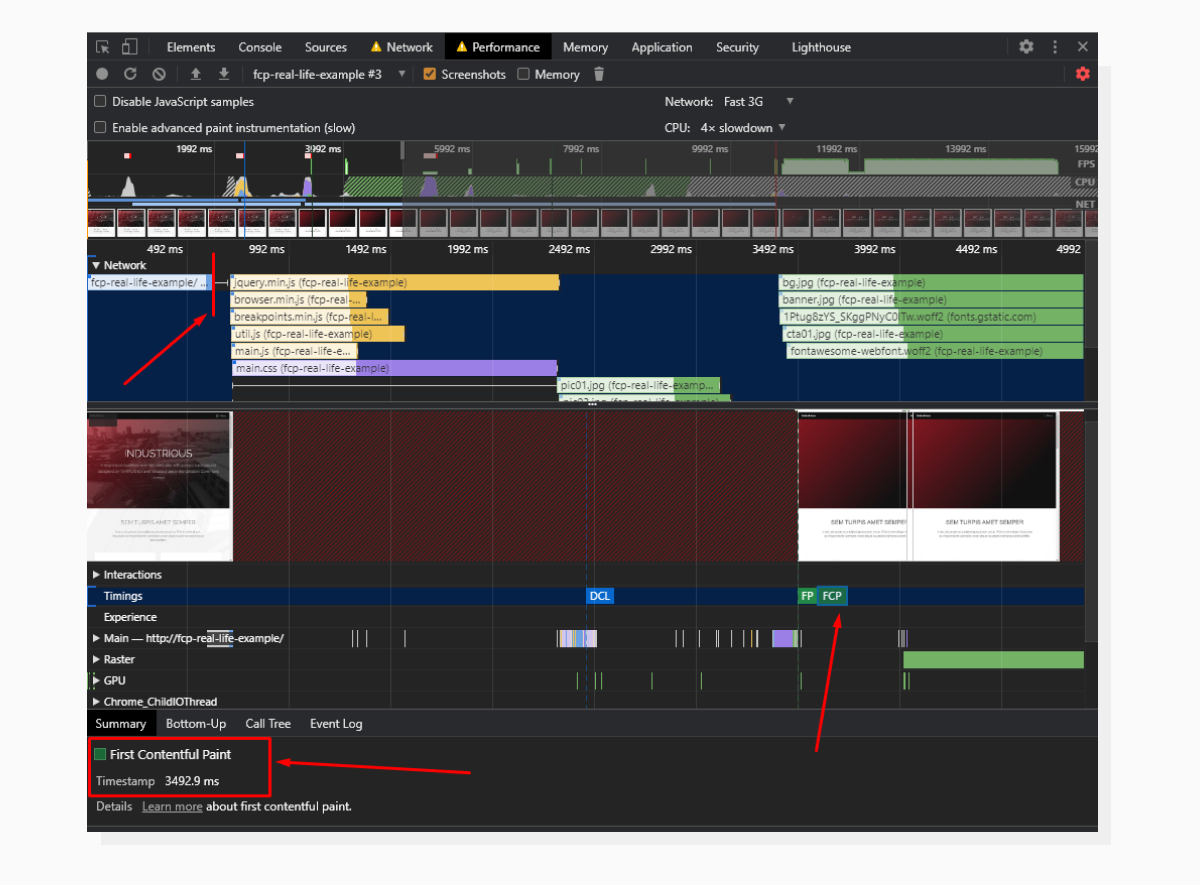
Previously, the Performance tab stated that the FCP happened at the 4381ms timestamp. Let’s remove the delay from the server-side code and run the test again.
Now, the initial request takes about 0.6 seconds to complete and FCP has moved from the 4831ms timestamp to the 3492ms timestamp.
The last time we ran the Lighthouse audit, the overall score was 35, with an FCP at 8.6s. It’s important to run audits after every change. Let’s check the website again to see if we have any improvement.
We do have significant positive changes. The score is now in the yellow zone, and FCP has improved drastically. Please take into account that the score might fluctuate from time to time, but anyway, going from more than 8 seconds to 3.5 seconds is considered to be a good result.
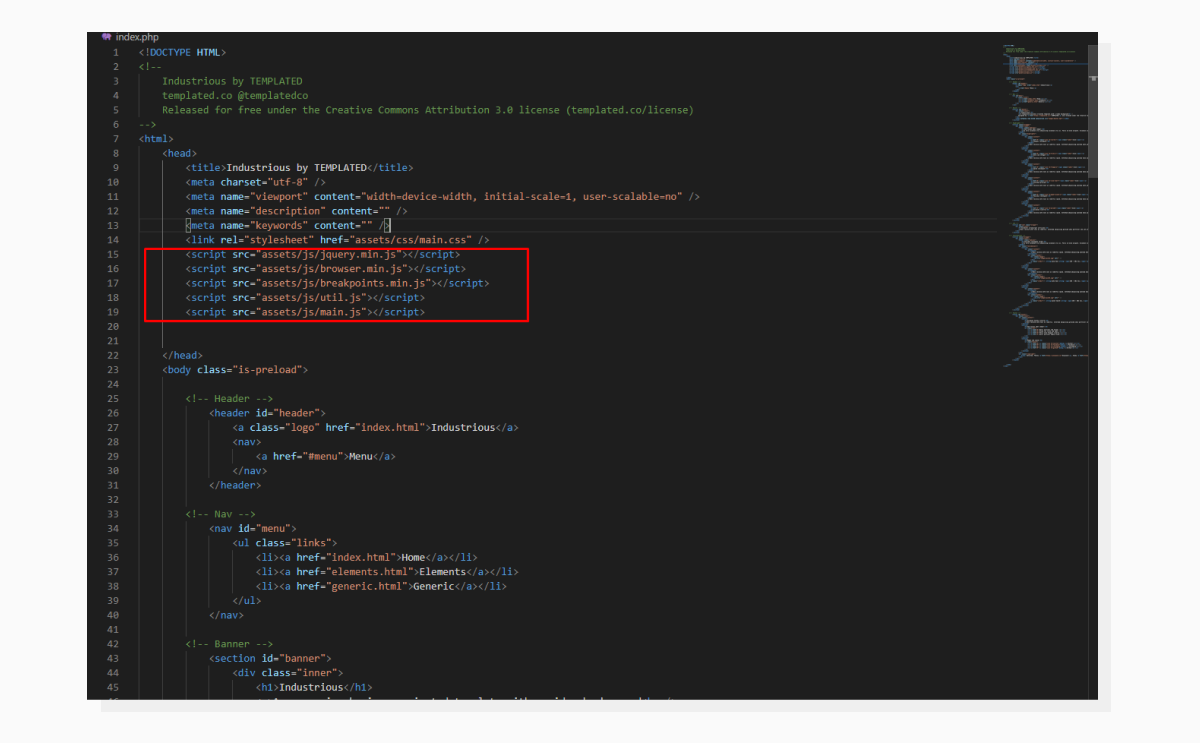
Render-Blocking resources
Resources that block the page rendering process until they are loaded are called Render-Blocking Resources. Usually, these are CSS and JS files that are included before the main content. Let’s see where they are in the page’s source code:
This means that the browser will stop the rendering process and wait until these are loaded.
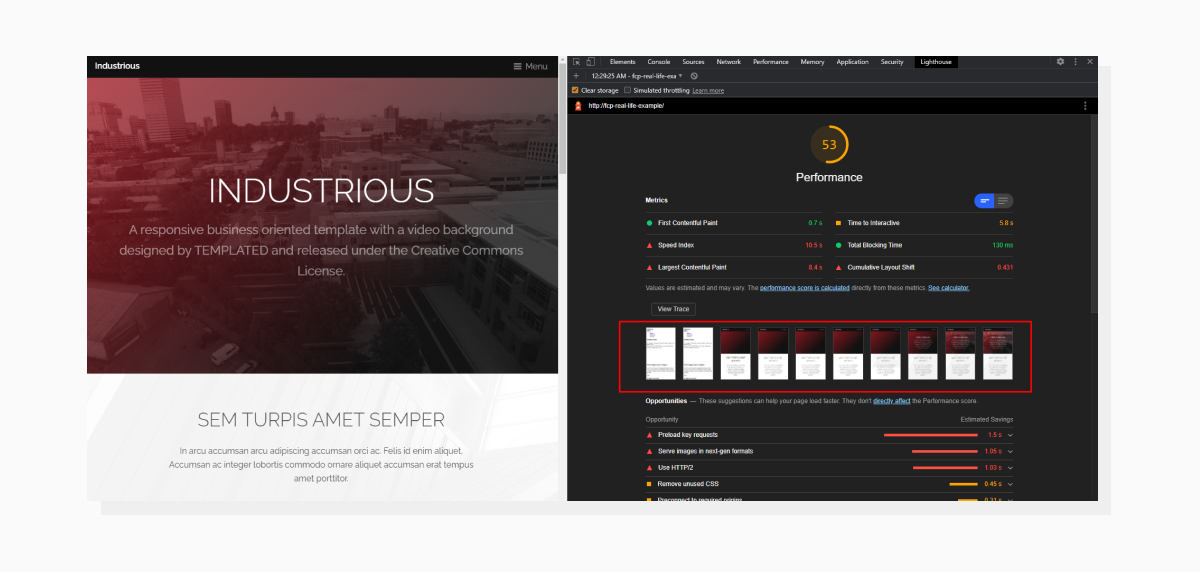
A simple solution comes up to mind: let’s just move them down to the closing </body> tag.
Hooray! FCP is green now. But, if we take a closer look at the series of page screenshots, we can see that the initial loading steps reveal the page without any styling. And this is an expected behavior: the page starts rendering elements even before it knows how to style them.
A solution for this would be to build Critical CSS.
Critical CSS
This term describes a set of CSS rules needed to display “above-the-fold” content. This is the content that shows immediately on the first screen. Everything that requires scrolling to reveal is called “below-the-fold” content.
The point here is to select only those rules that are required to render the first screen visible in the viewport and include them before the content. The main CSS file is included at the bottom of the page.
Luckily, we won’t need to go through the entire CSS file manually and cherry-pick the required styles. There are automated tools for this, even online ones.
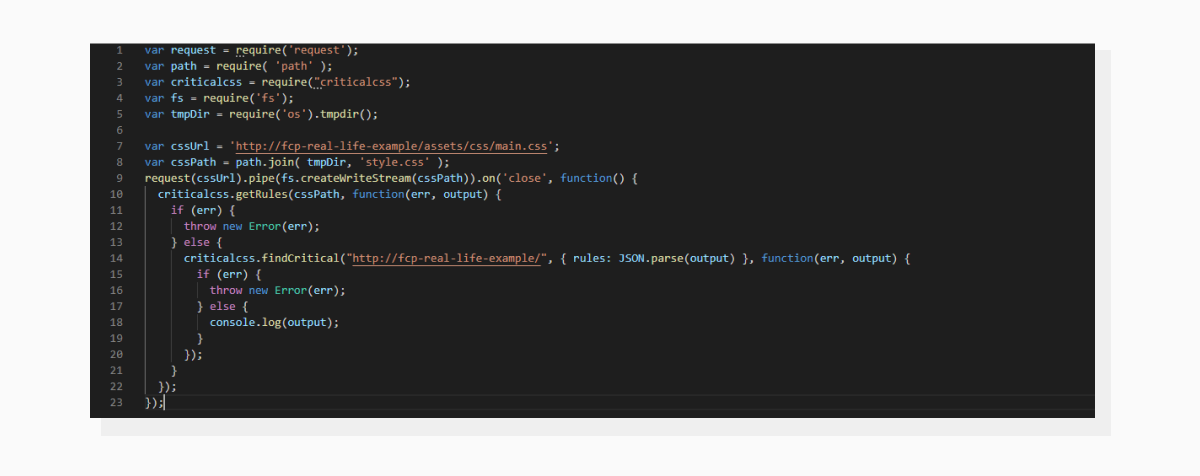
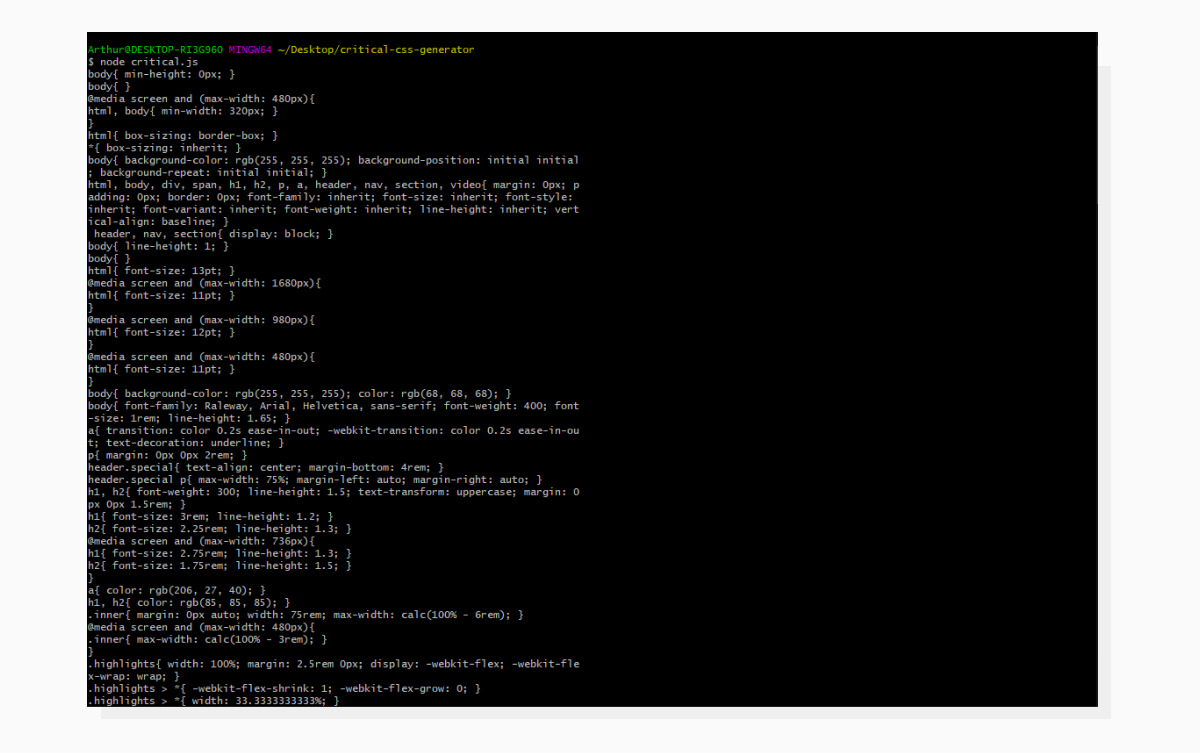
In this example, I used the CriticalCSS NPM package to build critical CSS.
Now let’s copy this CSS and paste it into the <head> section using a <style> tag. Keep the main styles file at the bottom of the page.
Time to analyze the page again:
This technique will most likely require tailored adjustments in your particular case; in fact, even in this case it does. The Critical CSS will be more precise if you utilize additional package options to set delay time (to get the page fully loaded), define viewport size, build CSS for several sizes, etc. More info on this is available here:
👉https://www.npmjs.com/package/criticalcss
Images and their impact on performance
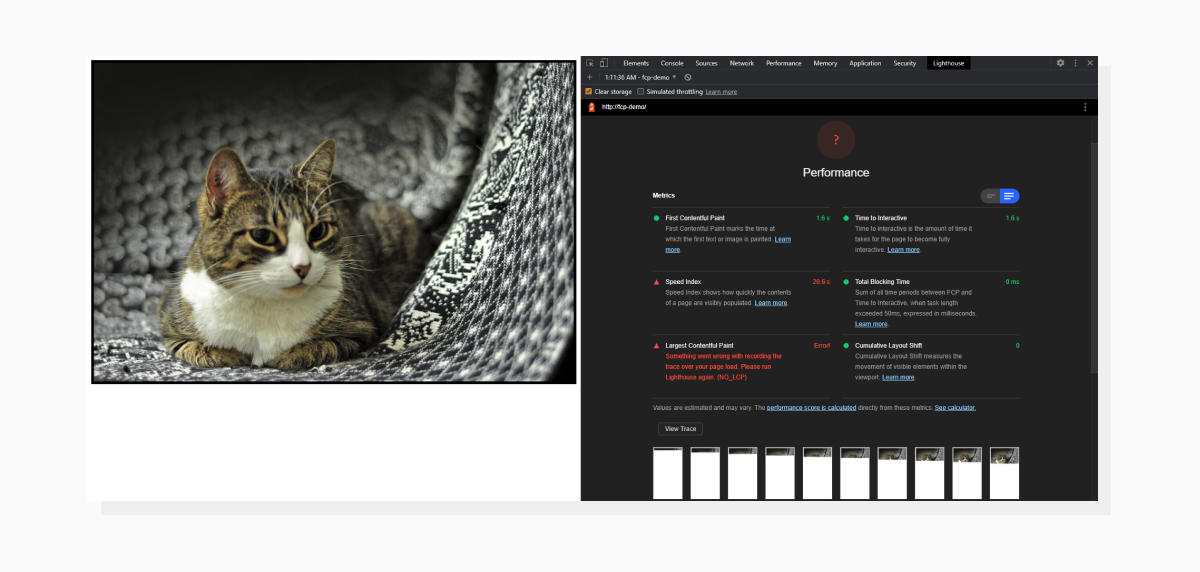
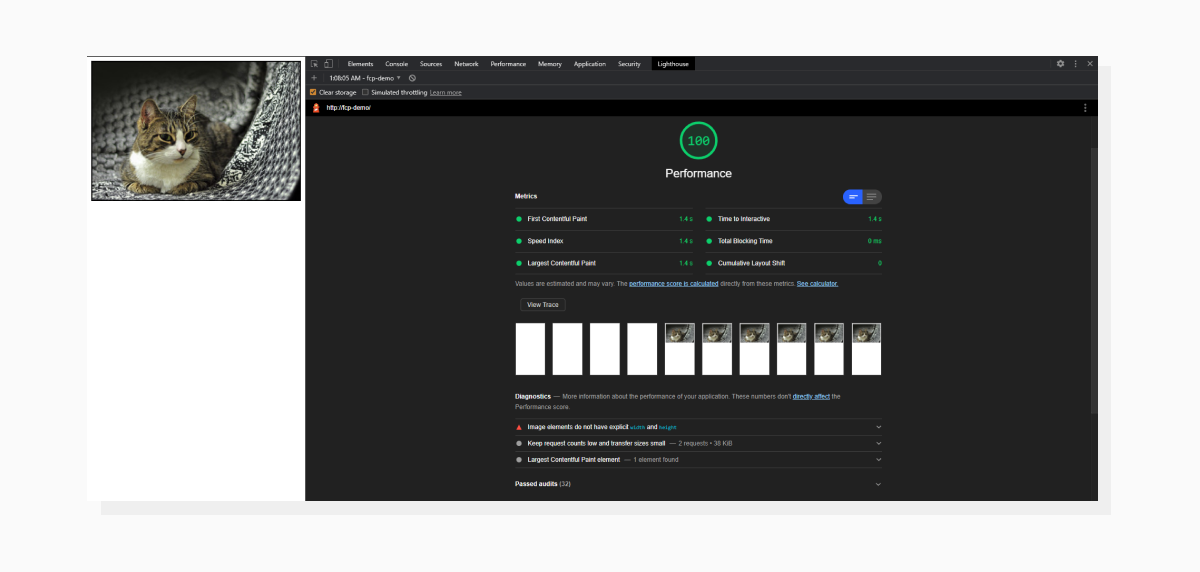
When defining FCP, I mentioned that the first piece of content rendered could also be an image. I conducted a little experiment: I used two different versions of the same image (photo by Sushi Raider) and ran an audit for each case. Let’s take a look at the screenshots:
Above is an example of using an unoptimized image. It weighs around 10MB and is 4214 pixels wide, which is too much for a mobile device (we’re still running tests within a mobile environment).
But, if we take a smaller, more optimized version of the same image, then:
This image is now only 32 KB and it’s not much wider than the viewport. Now, not only do we have better FCP results, but also a much better Speed Index as well. The latter shows the perceptual page loading speed. This demonstrates how important it is to have optimized images on your website to improve overall performance and speed, including First Contentful Paint.
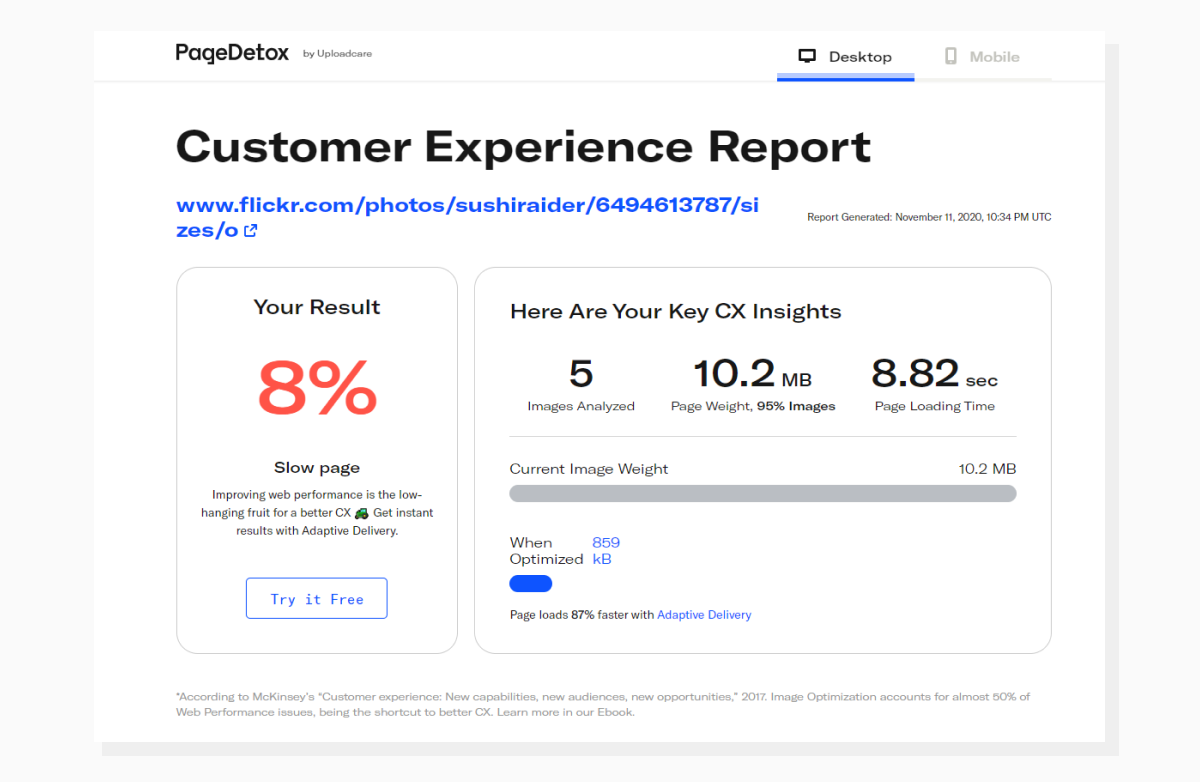
If you want to get detailed reports about images on your website, check out PageDetox. It’s a free tool for image performance analysis by Uploadcare. As an example, let’s take the page with the cat, open the full-size image and run it through the tool. Here are the results:
To sum up
Now you know the steps you need to take in order to improve the First Contentful Paint metric and get better overall results. Plus, I’d like to add that we optimize websites for people, not for bots. The key to the whole process is aiming to find that sweet spot between excellent lab data and a good UX (user experience) for the visitor.
Good luck with your optimizations!