What is Largest Contentful Paint and how to improve it
Last edited:
You may have stumbled upon the following scenario when searching for something on the web:
- Judging by the title and description in the search engine, it seems that you have found the perfect article on the topic.
- You follow the link.
- Elements start loading: website header and logo pop up, along with menu buttons, decorative images, and maybe ads.
But not the content itself. This is especially applicable to not-so-perfect connections such as mobile data and public WiFi networks.
The case above is a shining example of poorly optimized Largest Contentful Paint.
The Largest Contentful Paint metric (LCP) reports the time it takes for the largest element within the viewport to be rendered. In the same category as First Contentful Paint and Speed Index, LCP is a user-centric metric that displays the perceived load speed of the main content on the page.
The reason behind LCP
LCP is definitely not a pioneering solution in monitoring the page loading process.
JavaScript events like DOMContentLoaded or load fire when a page has finished loading,
but in more of a technical way rather than what a human would define as “completely loaded.”
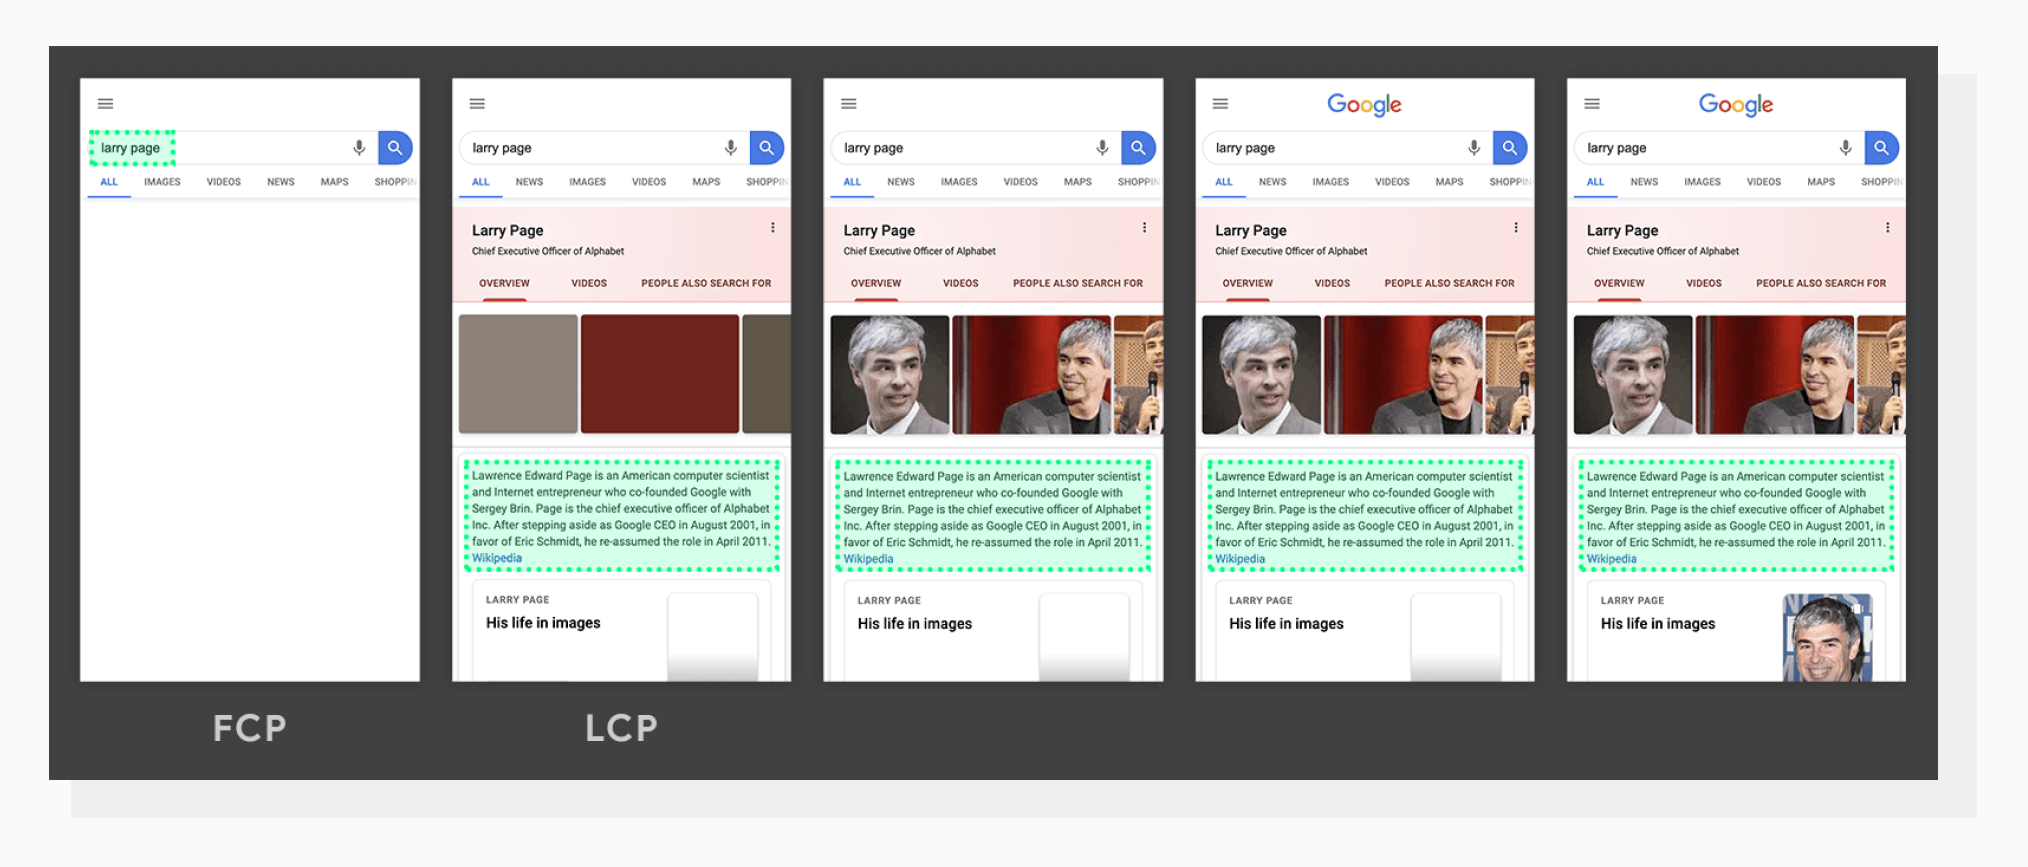 A demo of how LCP changes over time.
The Largest Contentful Paint, in turn, is triggered when the biggest element within the viewport is displayed. This also means that during the page-loading process, the value is likely to be changed, since the biggest element may change as well.
Why should I care?
There can be different answers to this question in different sources, but from my experience, a simple rule works here: people don’t like waiting. If a website doesn’t reveal the main content fast, visitors are most likely to close the page and go to a competitor’s website. SEO algorithms change over time, but historically, this type of behavior hasn’t been favored either by search engines or by visitors themselves.
Having a good LCP score usually means that your visitors won’t have problems getting relevant information without waiting too much. Please note that not all websites may have the main content in the biggest block inside the viewport, but that’s a very common case.
What content is eligible for LCP?
Not every type of rendered content can trigger this metric. At the time of writing this article, the types of elements are:
<img>elements<image>tags used within<svg><video>elements- A background image set via a CSS
url()function - Block-level elements that contain text nodes (this is what main text content usually is), and other inline-level text elements.
LCP score benchmarks
As usual, Google Lighthouse compares your particular results to other websites’ LCPs and judges using the following:
- 0-2.5 seconds — Good
- 2.6-4.0 seconds — Needs Improvement
- More than 4.0 seconds — Poor
Currently, the metric’s weight in the whole Lighthouse audit is 25%. This makes LCP a great candidate for improvement. If you want to see a broader picture involving other metrics, you can play around with values in the interactive Lighthouse Scoring calculator.
Real-Life example #1. Unoptimized images
For the purpose of this demonstration, I will be using a free Meteor page template.
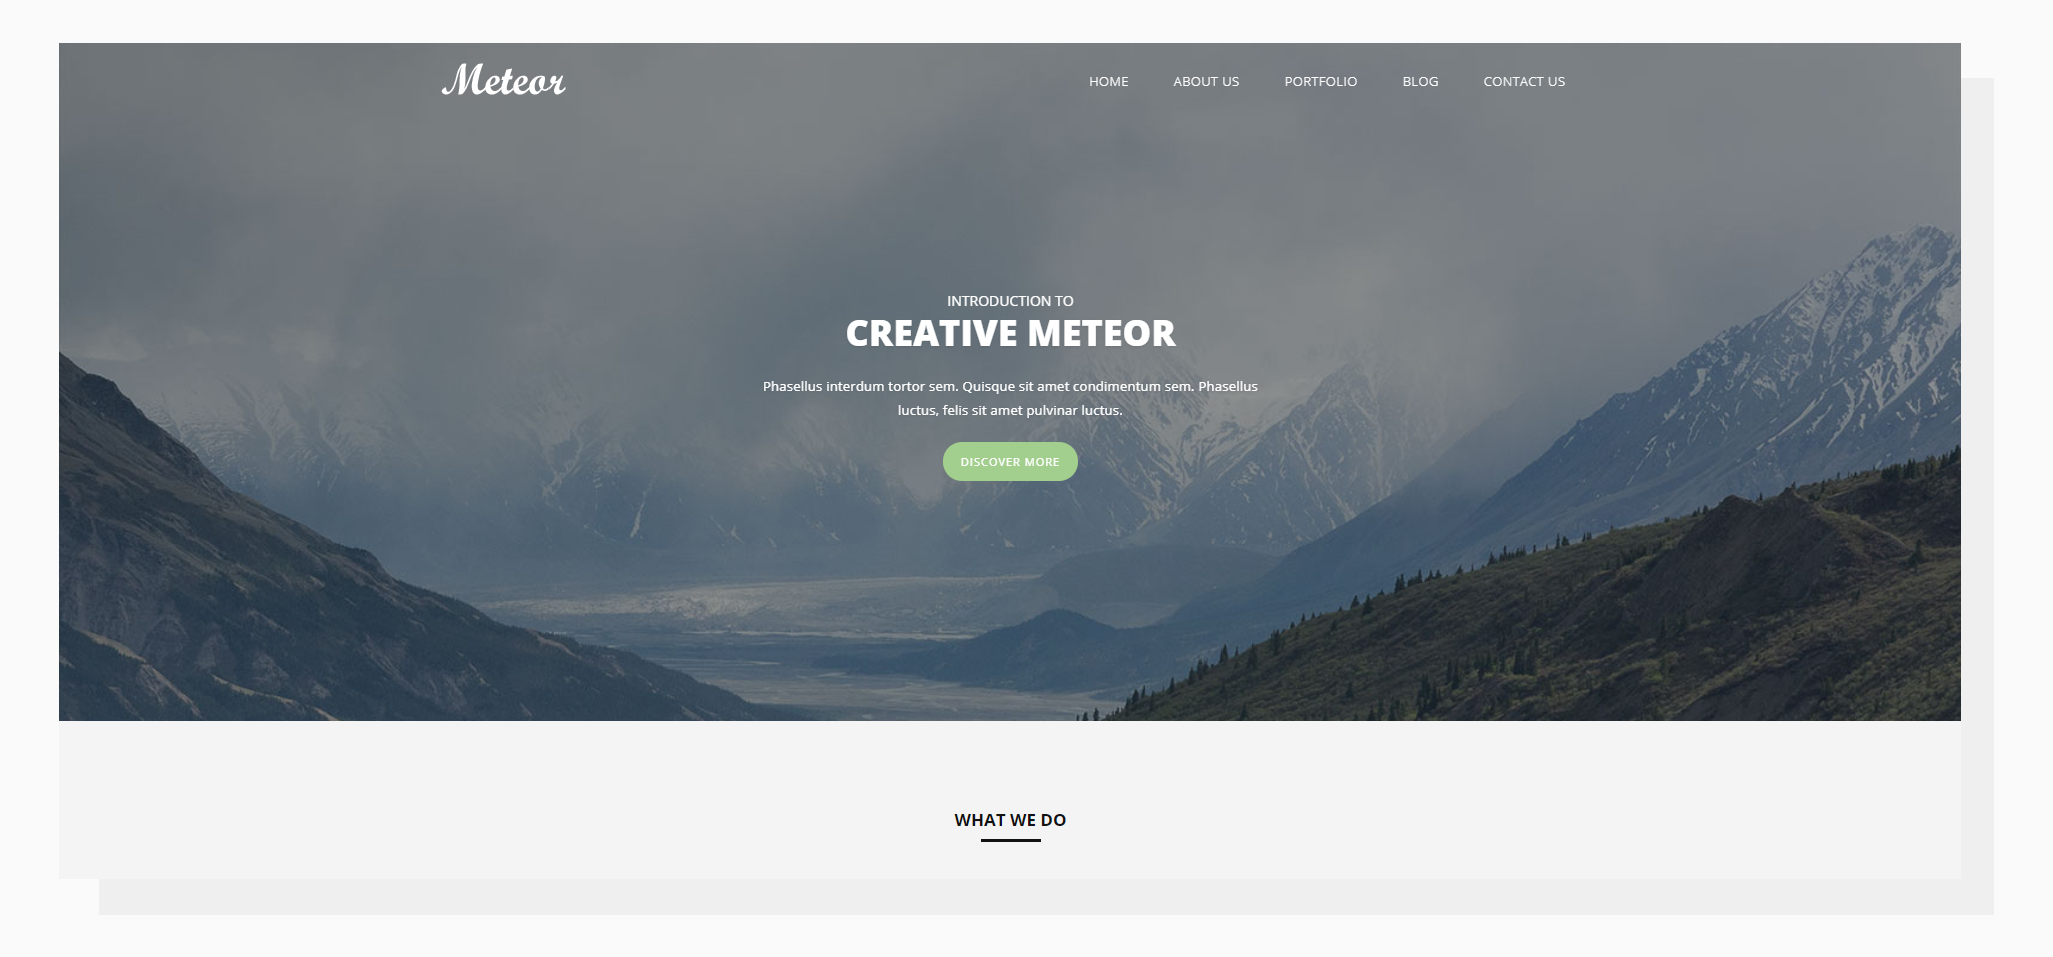 A screenshot of Meteor — our test subject for this section.
In my opinion, the big hero image makes this template a good fit for the demonstration:
- It occupies a big part of the viewport.
- The image is set as a background via a
url()function.
I intentionally upscaled the image to be “uncompressed” (6000×2813 pixels, 3.05 MB). While that may seem too drastic for real life, there are still many websites out there with unoptimized images. Running a Lighthouse Audit gave the following picture:
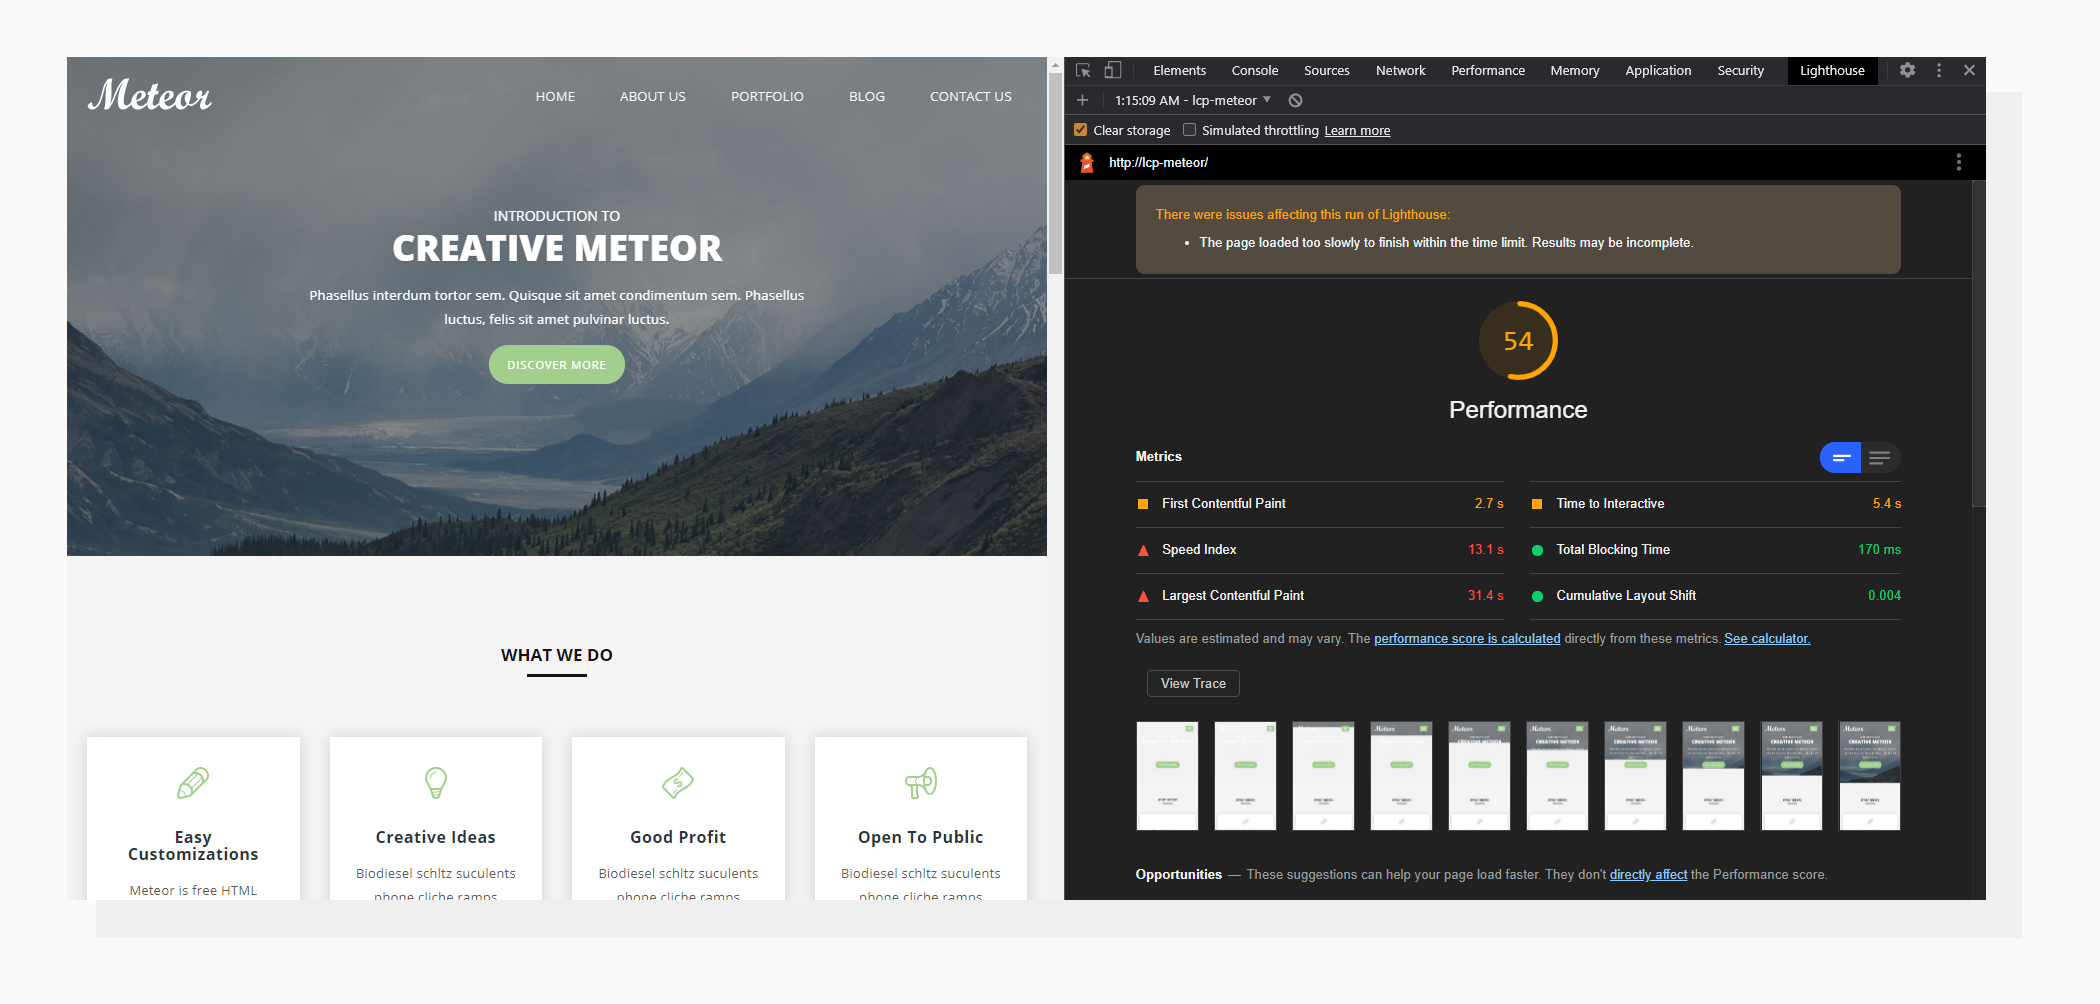 31.4 s — LCP time for an unoptimized hero image.
Please note that the Mobile option was selected for the audit. This means that Chrome will also simulate a slower connection and CPU speed.
Now let’s get back to the picture provided with the template. The dimensions are 1600×750 pixels and the size is 106 KB. Auditing again:
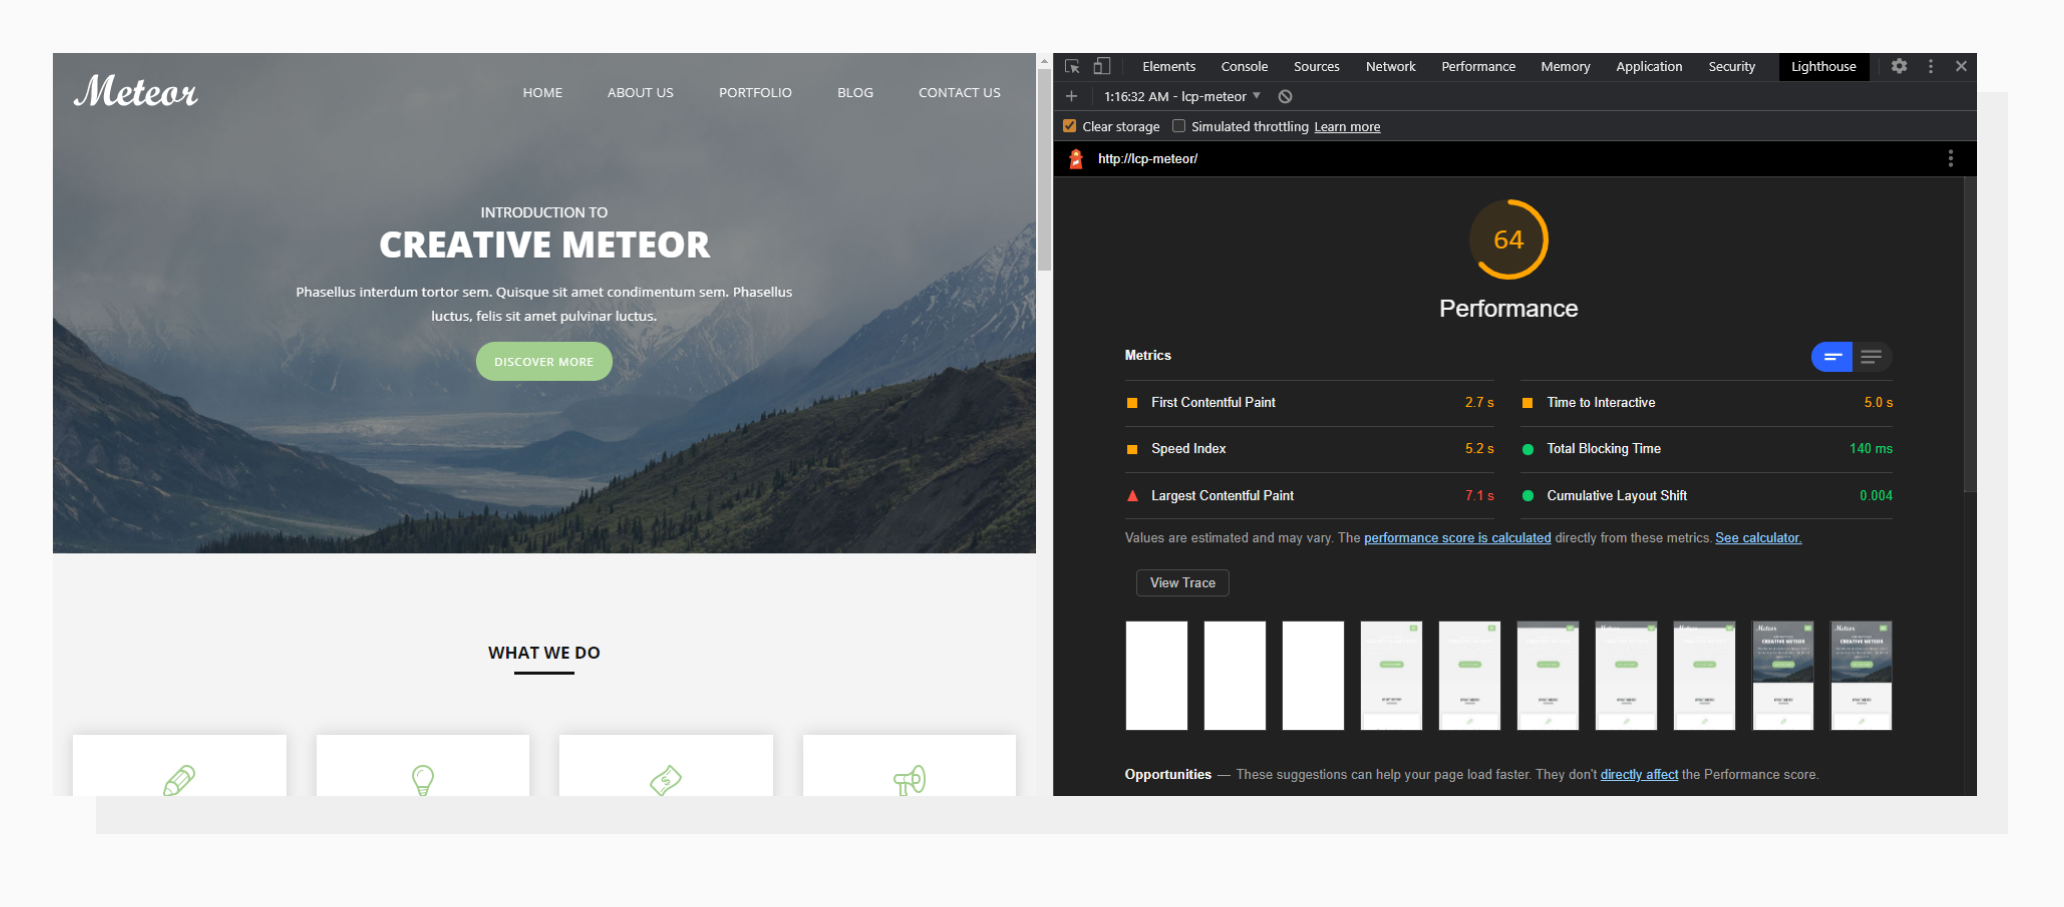 7.1 s — LCP time for an optimized image.
This time the results are better. That’s because the image takes less time and bandwidth to load, so the LCP is triggered earlier.
Real-Life example #2. Flash Of Invisible Text (FOIT)
FOIT is a term introduced to describe situations when text only becomes visible when the corresponding font is loaded. Modern browsers have mechanisms to deal with this issue, but if the behavior is set in CSS in an explicit way, it may harm website performance and LCP in particular.
Take a look at the following piece of code:
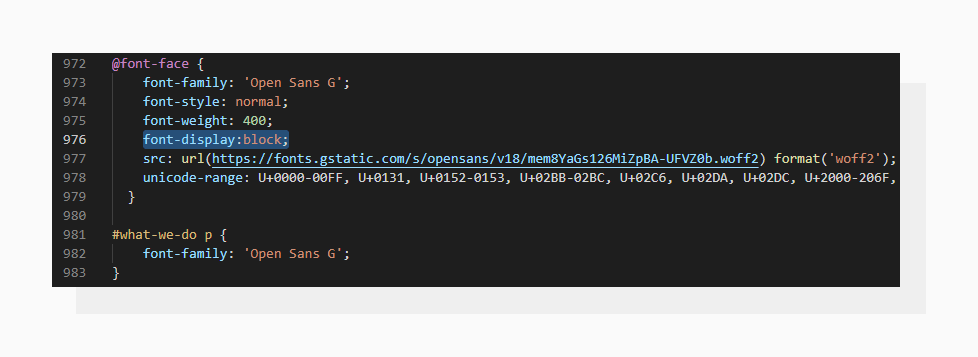 The “font-display” property determines how a font is displayed based on its loading state.
Simply put, font-display: block tells the browser not to display the text until a font is loaded.
Running an audit in this case gives the following results:
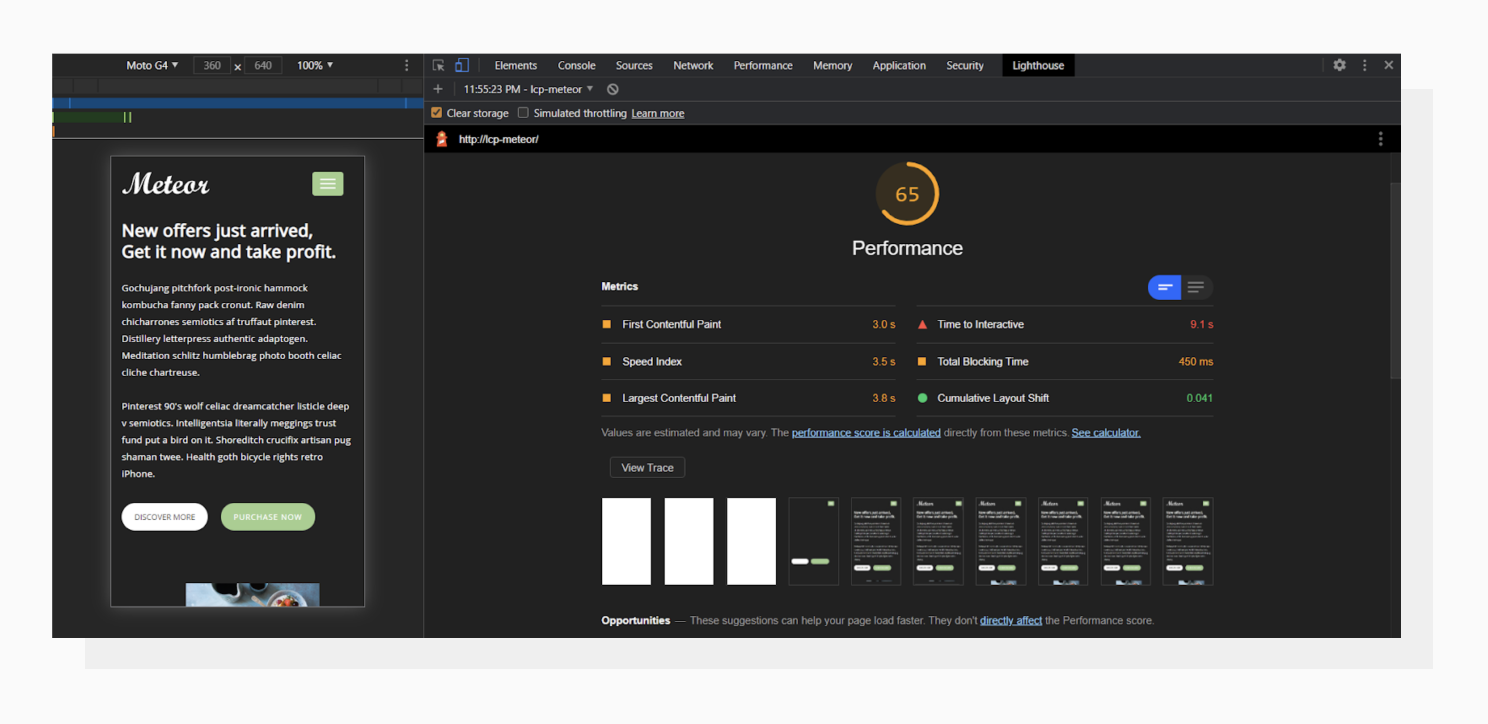 LCP is 3.8 s. The overall Performance Score is 65.
In the screenshot sequence there’s a frame without text but with further elements rendered. And then, once the font has been loaded, the text appears and triggers the LCP.
A good practice is to let the browser replace the font with a similar one until the desired font loads.
For this, let’s use font-display: swap instead and also set a fallback font:
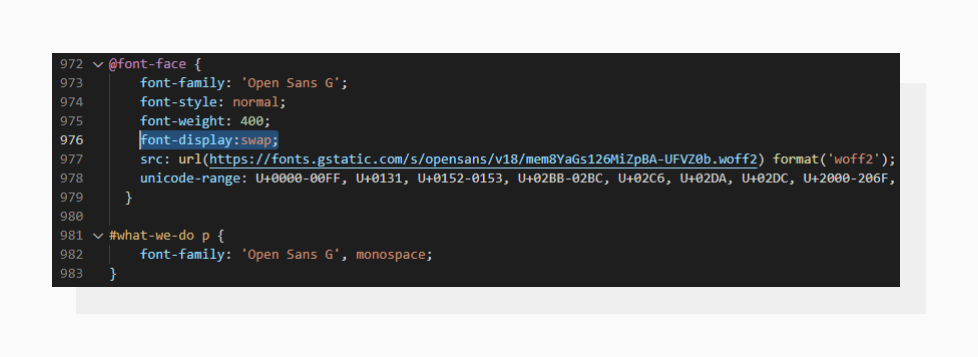 Preventing FOIT in code.
Running a test again:
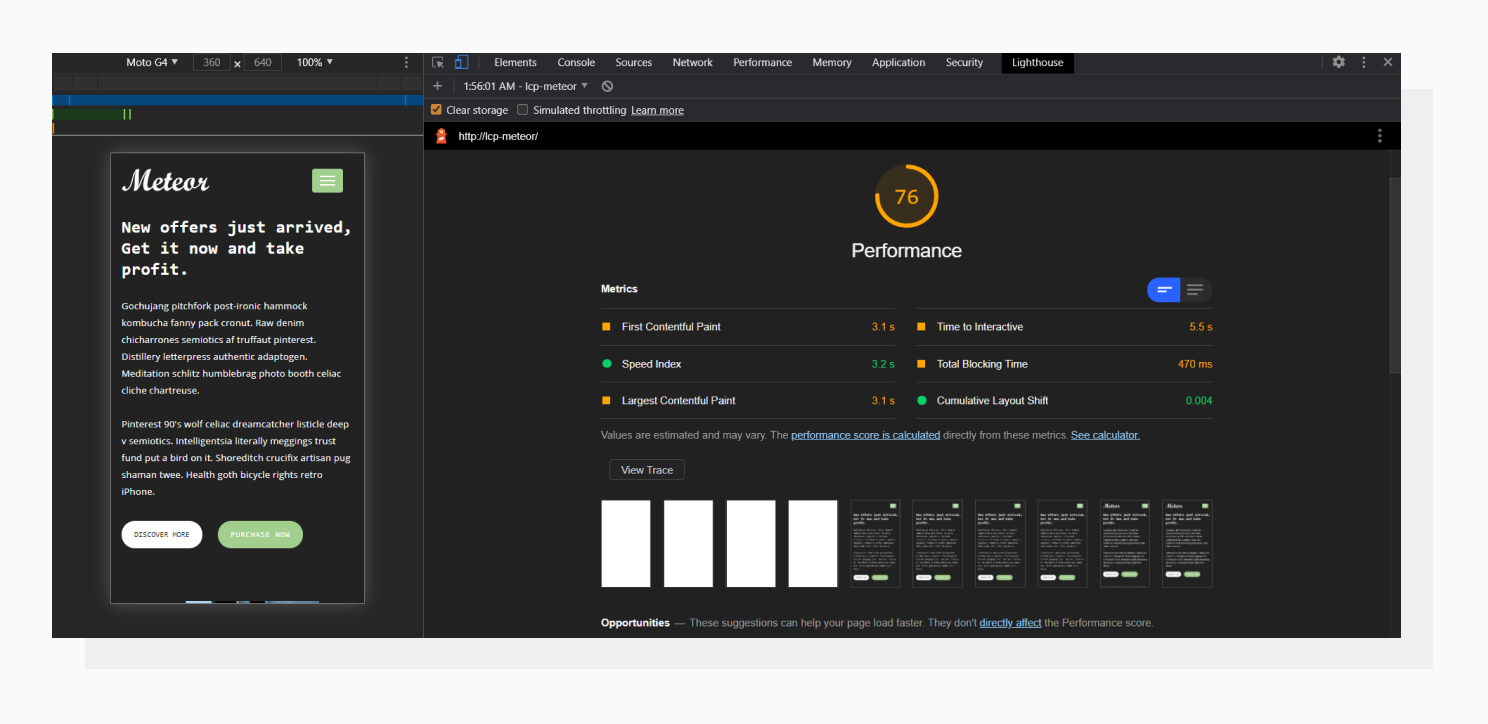 LCP metric after optimizing font loading: 3.1 s., the Performance Score is 76.
The LCP has definitely improved. Now the text is rendered with a fallback font, and then a remote font is applied. In this particular situation, the fallback font makes the text consume more space than the loaded font, and this makes the LCP trigger earlier. I’d recommend not abusing this just to get better numbers, because having layout shifts may harm the Cumulative Layout Shift metric.
LCP is not isolated. It’s connected to other metrics, such as FCP and Speed Index. Here the Speed Index improved as well, because the visual content changed faster.
Improving Largest Contentful Paint
Optimizing the LCP can be broken down into 3 main groups of tasks:
- Reducing network payload size
- Optimizing server performance and response times
- Optimizing front-end (render-blocking JavaScript and CSS)
Let’s now walk through each of these and determine what can usually be optimized.
1. Reducing network payload size
In the beginning of this article, I mentioned the types of HTML elements that can trigger the LCP. With the current popularity of full-page images or videos on the first visible screen, it would be efficient to optimize these types of content first.
For example, videos can be optimized by compressing them via online services, hosting them on YouTube, other video hosting platforms, or a CDN, or using techy command line tools like FFmpeg (which saved me lots of bytes).
As for images, scenarios may differ. Like with videos, compression tools can be used here as well; there is a variety of them. However, the modern web may require you to have the same image in 6 or more different resolutions to provide the best experience on different screen sizes.
In this case, it’s exhausting to manually edit and compress an image for each case. There’s a solution for this situation, which we’re going to mention closer to the end of the article after we get a broader picture of different optimizations.
2. Optimizing server performance and response times
Before sending an HTML page as a response, the server needs to do some heavy (sometimes too heavy) lifting. The goal here would be to find potential server-side bottlenecks and eliminate them as much as possible. The most common problems are:
-
Many database requests. This often happens on multi-purpose CMS tools, where lots of methods are database dependent. If you’re building a custom theme for a CMS, consider reducing the amount of database requests, or cache results where possible.
-
Slow third-party API. An API service’s speed is usually not under the developer’s control. There’s a chance that something may happen to any kind of service your website depends on, and this may possibly harm your Lighthouse metrics, including LCP. Also, establishing a connection and sending a new HTTP request is a time-consuming operation, even if the API is fast. For example, a request to get all the blog posts from a third-party API that fulfill certain conditions will be much faster than getting them one by one and checking the condition on your end.
-
General server performance. While growing, websites may come to a point where there’s no more room for significant optimizations. At this point it would be a good decision to upgrade the hosting plan, or switch providers or type of hosting, for example by switching from Shared Server to Dedicated Server.
3. Optimizing front end
The main idea here is to prevent JavaScript code from blocking the page rendering process.
To render content, a browser first needs to parse the HTML received from the server and put it into a DOM tree.
Any blocking scripts (i.e., without defer and async attributes) encountered while parsing will pause the rendering process until they finish executing.
This will affect both First Contentful Paint and Largest Contentful Paint in a negative way.
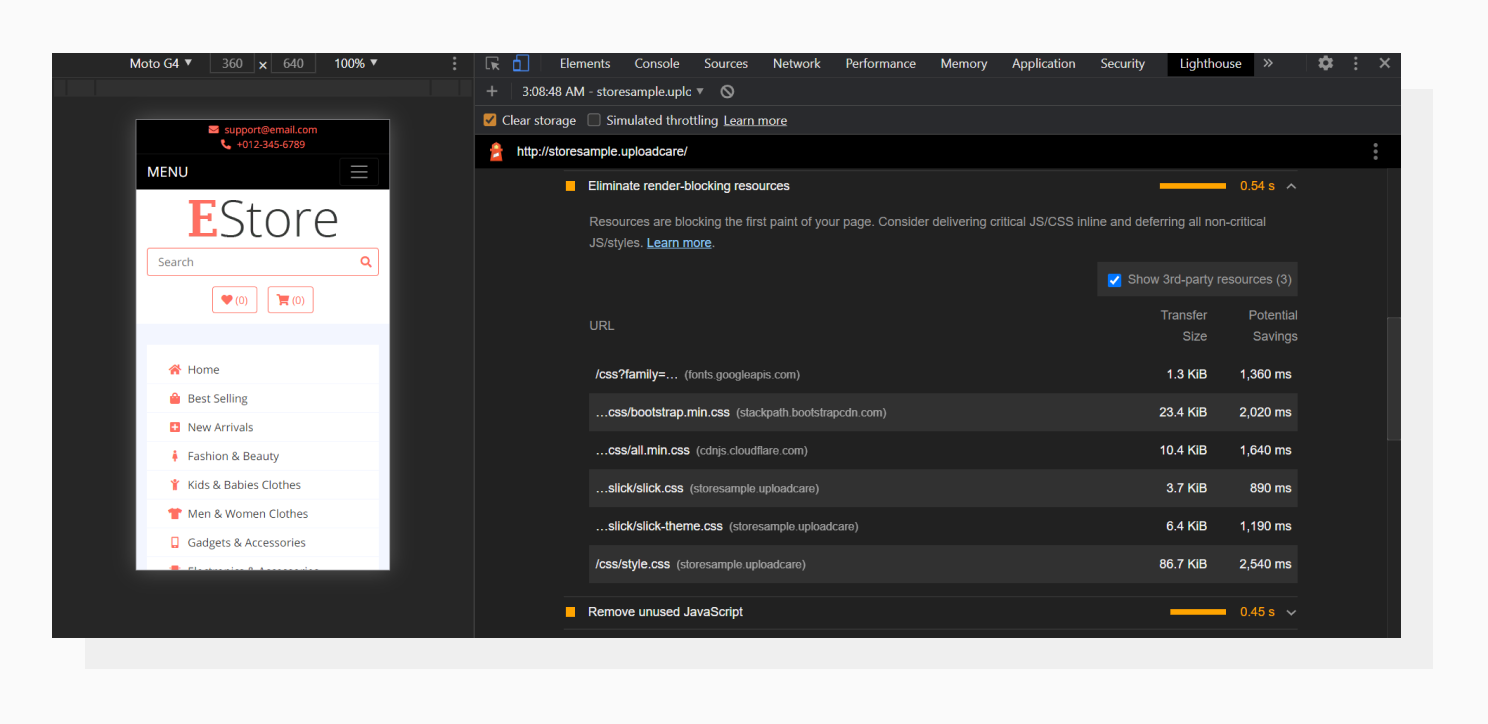 There’s a tab in Lighthouse where render-blocking resources are listed.
Try moving non-critical scripts to the bottom of the <body> tag or using the defer attribute.
From my experience, it’s not always possible to get rid of all the render-blocking resources mentioned by Lighthouse.
Instead, it’s better to aim for a mix of good UX and loading speed. The same applies to render-blocking CSS.
Consider using the preload attribute to load critical resources only, like fonts or scripts,
as early as possible during the page load process, even before they’re needed to improve the LCP score e.g:
<link rel="preload" href="open-sans.woff2" as="font" crossorigin="anonymous">
<link rel="preload" href="style.css" as="style">
<link rel="preload" href="script.js" as="script">
Automatic image optimization
Remember I mentioned a solution for easy responsive image optimization? Let me introduce Adaptive Delivery. It’s a full-stack image optimization solution that automatically provides a version of the image based on the user context: screen size, browser, location and other parameters. As a result, you get an image that’s the best fit for the visitor’s device in terms of resolution, pixel density and, something that really affects the network payload, size. And an optimized hero image leads to better LCP results.
Conclusion
LCP can be seen as a metric that displays the general “health” of your website performance. It consists of different optimizations, and covering literally all of them in detail goes beyond the scope of this article. But as a simple and effective solution, working with images may give a significant boost to overall website performance, increasing metrics including LCP.
Instead of going through each image manually, you can use PageDetox, a tool developed by Uploadcare. It will give you a detailed analysis of the images you have on your pages, as well as the potential speed increase if Adaptive Delivery is used on your website to automatically make images responsive. Give the tool a try: good websites deserve good LCP times.