The guide to eCommerce metrics. Part 2. Pages viewed per shopping session
Last edited:
👉 The guide to eCommerce metrics. Intro
👉 Part 1. The total number of visits
👉 Part 2. Pages viewed per shopping session (you're here)
👉 Part 3. The number of active customers
👉 Part 4. eCommerce conversion rate
Previously we looked at the total number of visits, the top-of-the-funnel ecommerce metric, also called “sessions” by Google. Now you know that it helps measure sales conversion and bounce rates, and shows how good you are at acquiring traffic.
Let’s imagine that your marketing activities are a huge success, and you get heaps of visits to your website or app. The pages viewed per session metric will help you make sure that your content is engaging enough and you eventually meet your revenue targets.
What’s pages viewed per session and why is it important?
Pages viewed per session is the average number of pages a user browses each session. This is how you can calculate it:
Pages Viewed per Session = Pageviews / Total Number of Visits
Pageviews are counted every time a user views a page. You might be thinking, “Thanks, Captain Obvious!”, but there is something to keep in mind: if a person refreshes the same page or goes back and forth, these moves will be included in the total amount too.
Then you need to divide pageviews by the total number of visits, which shows the number of times somebody surfs to your website.
To calculate the pages viewed per session in the example below, we divide 15 by 3 and get 5:
| Visits | Pageviews | |
| User A | 1 | 5 |
| User B | 1 | 3 |
| User C | 1 | 7 |
| Total | 3 | 15 |
One of the main goals (and challenges) of online retail is to show visitors as many products as necessary to make a purchase decision. A lot depends on the target audience, product category, and the stage of the customer’s journey, but on average, the more items we see, the more likely we are to find what we’re looking for.
This will probably change with the evolving trends of personalization and machine learning. However, for now we’re still living in the era of opening dozens of tabs and swiping left on Tinder.
That’s why the pages viewed per session metric is crucial for ecommerce business, as it shows:
- the demand for the products or brands you sell,
- the relevancy of the offers you make,
- the effectiveness of acquisition channels you bank on,
- the quality of the shopping experience you provide.
Pages per session in Google Analytics
You can find the pages per session metric in the Behavior section of Google Analytics. And here’s a tip: If you hover the question mark next to the metric name, you’ll see its description:
 An average user of this online shop views 5.21 pages per shopping session
To go deeper, compare pages per session across different channels, sources, or even ad campaigns. This analysis will reveal where the most engaged users come from and indicate which channels to scale or cut back on.
You can also segment visits, distilling only those that contain product page views and come up with an even more precise metric: pages viewed per shopping session.
How many pages per session is okay?
According to Littledata, who analyzed 3,698 sites, the average value of pages per session is between 1.8 and 4.4. If you hit more than 4.4, your website is among the best 20% of the websites in their study. If it’s lower than 1.4, you’re wasting your money on advertising.
However, as we already mentioned before, the pages per session value and goals depend on the industry. If you have online media, the more pages people view, the more ads they see, and the more you earn. If you own a single-page website, this metric is useless.
When it comes to ecommerce, here are some benchmarks by SimilarWeb for 2020:
- Average pages per visit – 5.6 (vs. 8.1 in 2019)
- Average visit duration – 3m 56s (vs. 6m 47s in 2019)
- Average bounce rate – 47.28% (vs. 37.36% in 2019)
Compared to 2019, the trend is descending, which makes this metric even more critical. It seems people's attention spans are getting shorter and shorter, so you have to create a unique shopping experience to win their hearts and wallets.
3 Tips on how to increase the pages viewed per shopping session
Improving this metric is all about creating engaging content and providing a better online shopping experience. You might have the best products, but people won’t stick around if they’re displayed poorly or if the website’s performance is lousy.
Pro tip: turn more visitors into customers by reducing friction and making the most of visual content.
For details, check out the tips below. We illustrated them with examples from ASOS, who recently reported a 3.1m to 23.4m growth in their customer base and 18% growth in US sales. They also say they’ve achieved momentum in customer acquisition, and boast about high levels of engagement. Let’s see what they did.
Tip #1. Let the navigation serve your customer’s needs
Listen to your customers and experiment with the navigation: make menu entries resonate with the current customer demand and keep the most popular items easily available. The more relevant things people see at first glance, the more they’ll browse.
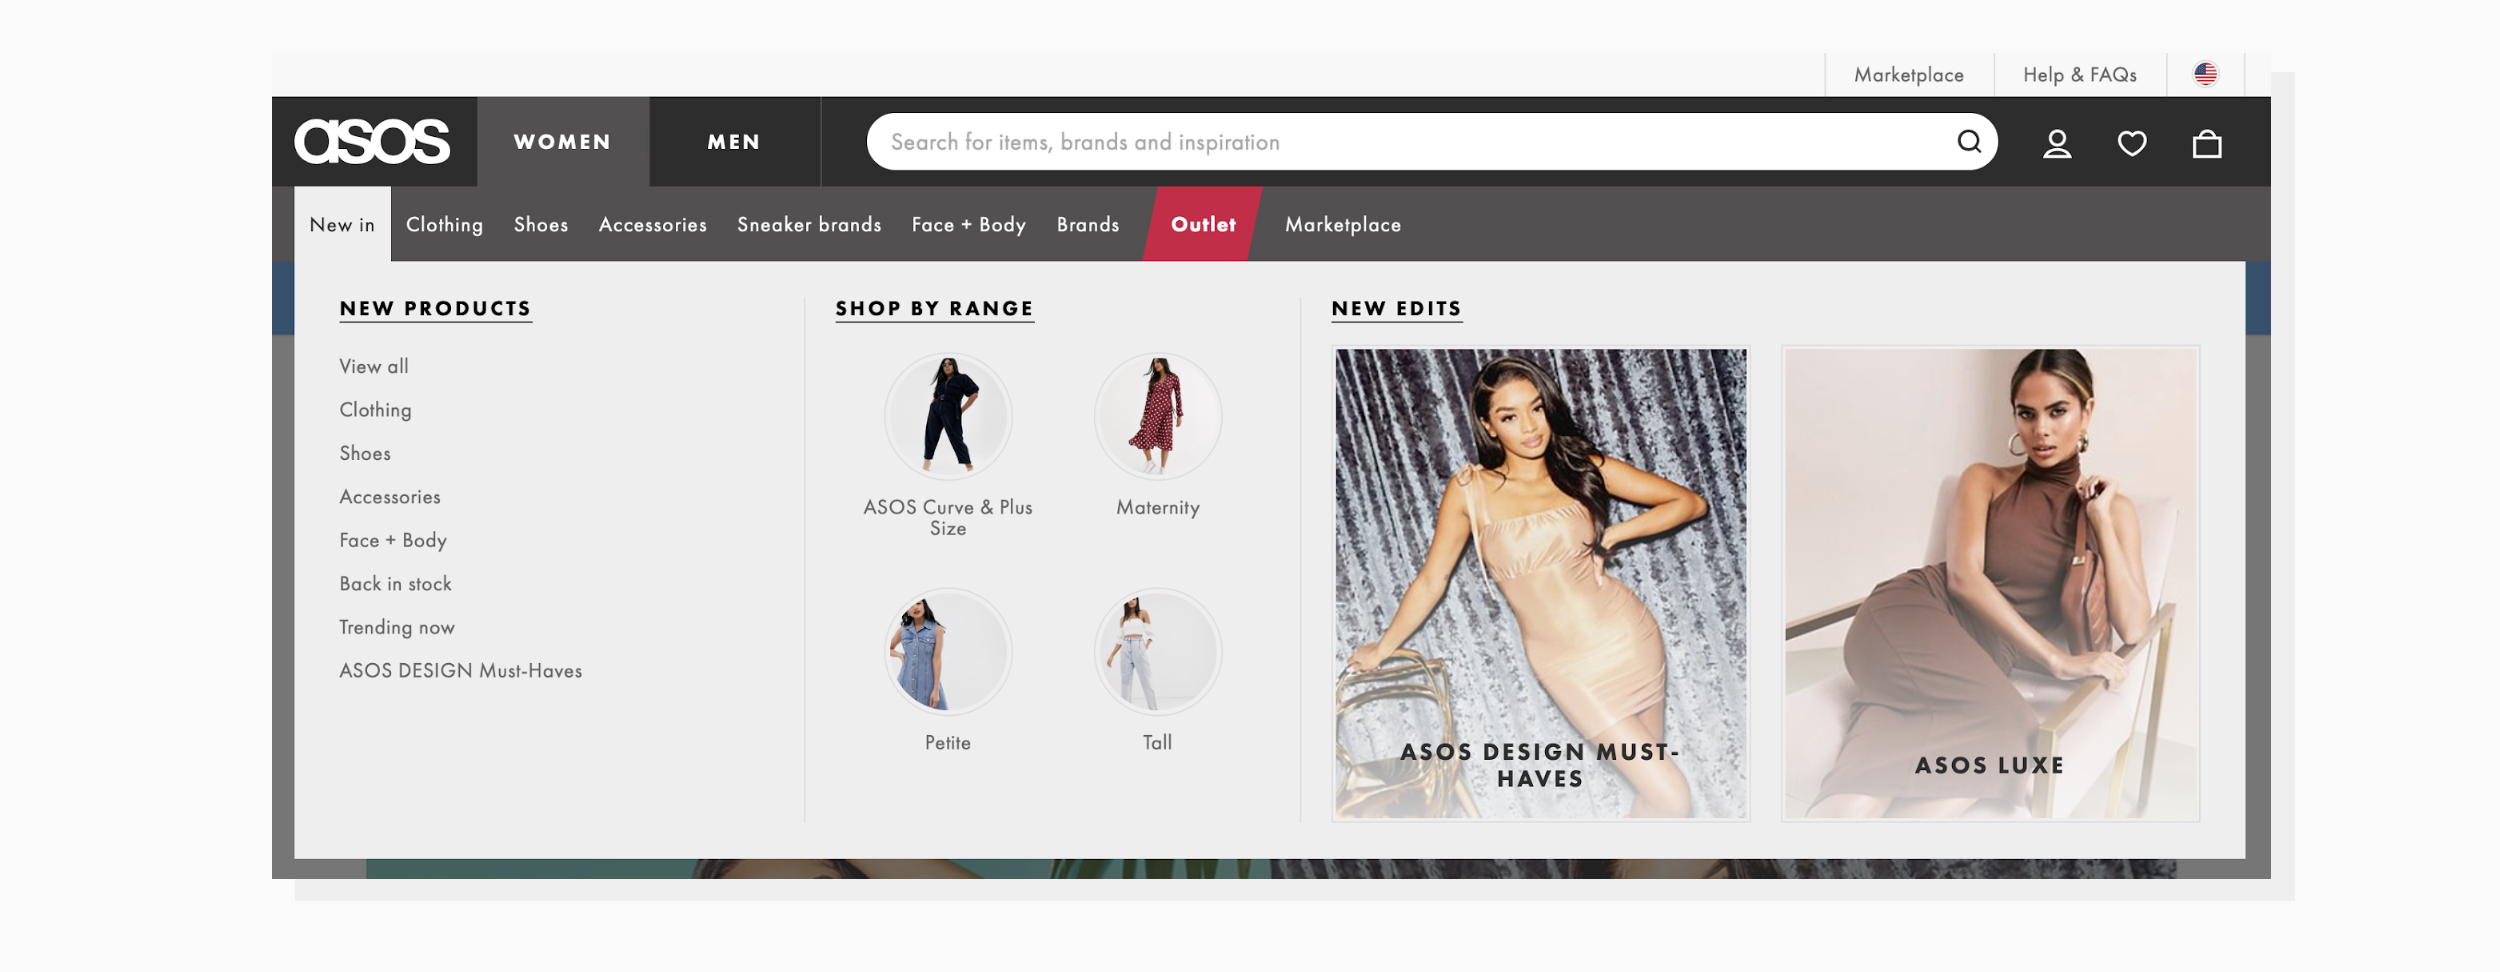
For instance, ASOS had to reshape its product offering due to the change of lifestyle brought about by COVID. Already famous for “going out” items, the online shop had to start focusing on “staying in” products like casualwear, activewear, and Face + Body products. This is reflected in the menu groupings, featured items, and recommendations.
They also report a 13% year-on-year increase in new product popularity, as people were more likely to browse for something new and trendy during and after the lockdown. The “New in” menu entry goes first in the main menu bar:
 Judging by the menu entries, the ASOS audience is most interested in new products and outlet items
The handy ASOS search bar offers the ability to look for items, brands, and inspiration so that you’ll end up browsing at least a few pages, even if you don’t know exactly what you want.
One more cool thing to copy from ASOS is menu groupings that sort the items according to the user’s context: sports activities, brand preferences, sizes or life events. By narrowing down the selection, you make the content more relevant, and encourage visitors to browse deeper.
And if you have a mobile app, make sure that your navigation works well on the whole range of mobile devices. The ASOS mobile website looks more simple than the desktop version, but it’s convenient to use: the main menu is hidden in the burger menu, the font size is large, and the CTAs are bold. You can easily browse items without fear of pressing the wrong button or closing the window.
Tip #2. Have a plain and clear product page layout with great visuals
It’s all a matter of first impressions: the total number of pages people view depends on the first product page they visit. If the layout is clean and clear, and the information about the product is sufficient, they will go on browsing, raising your pages per session metric.
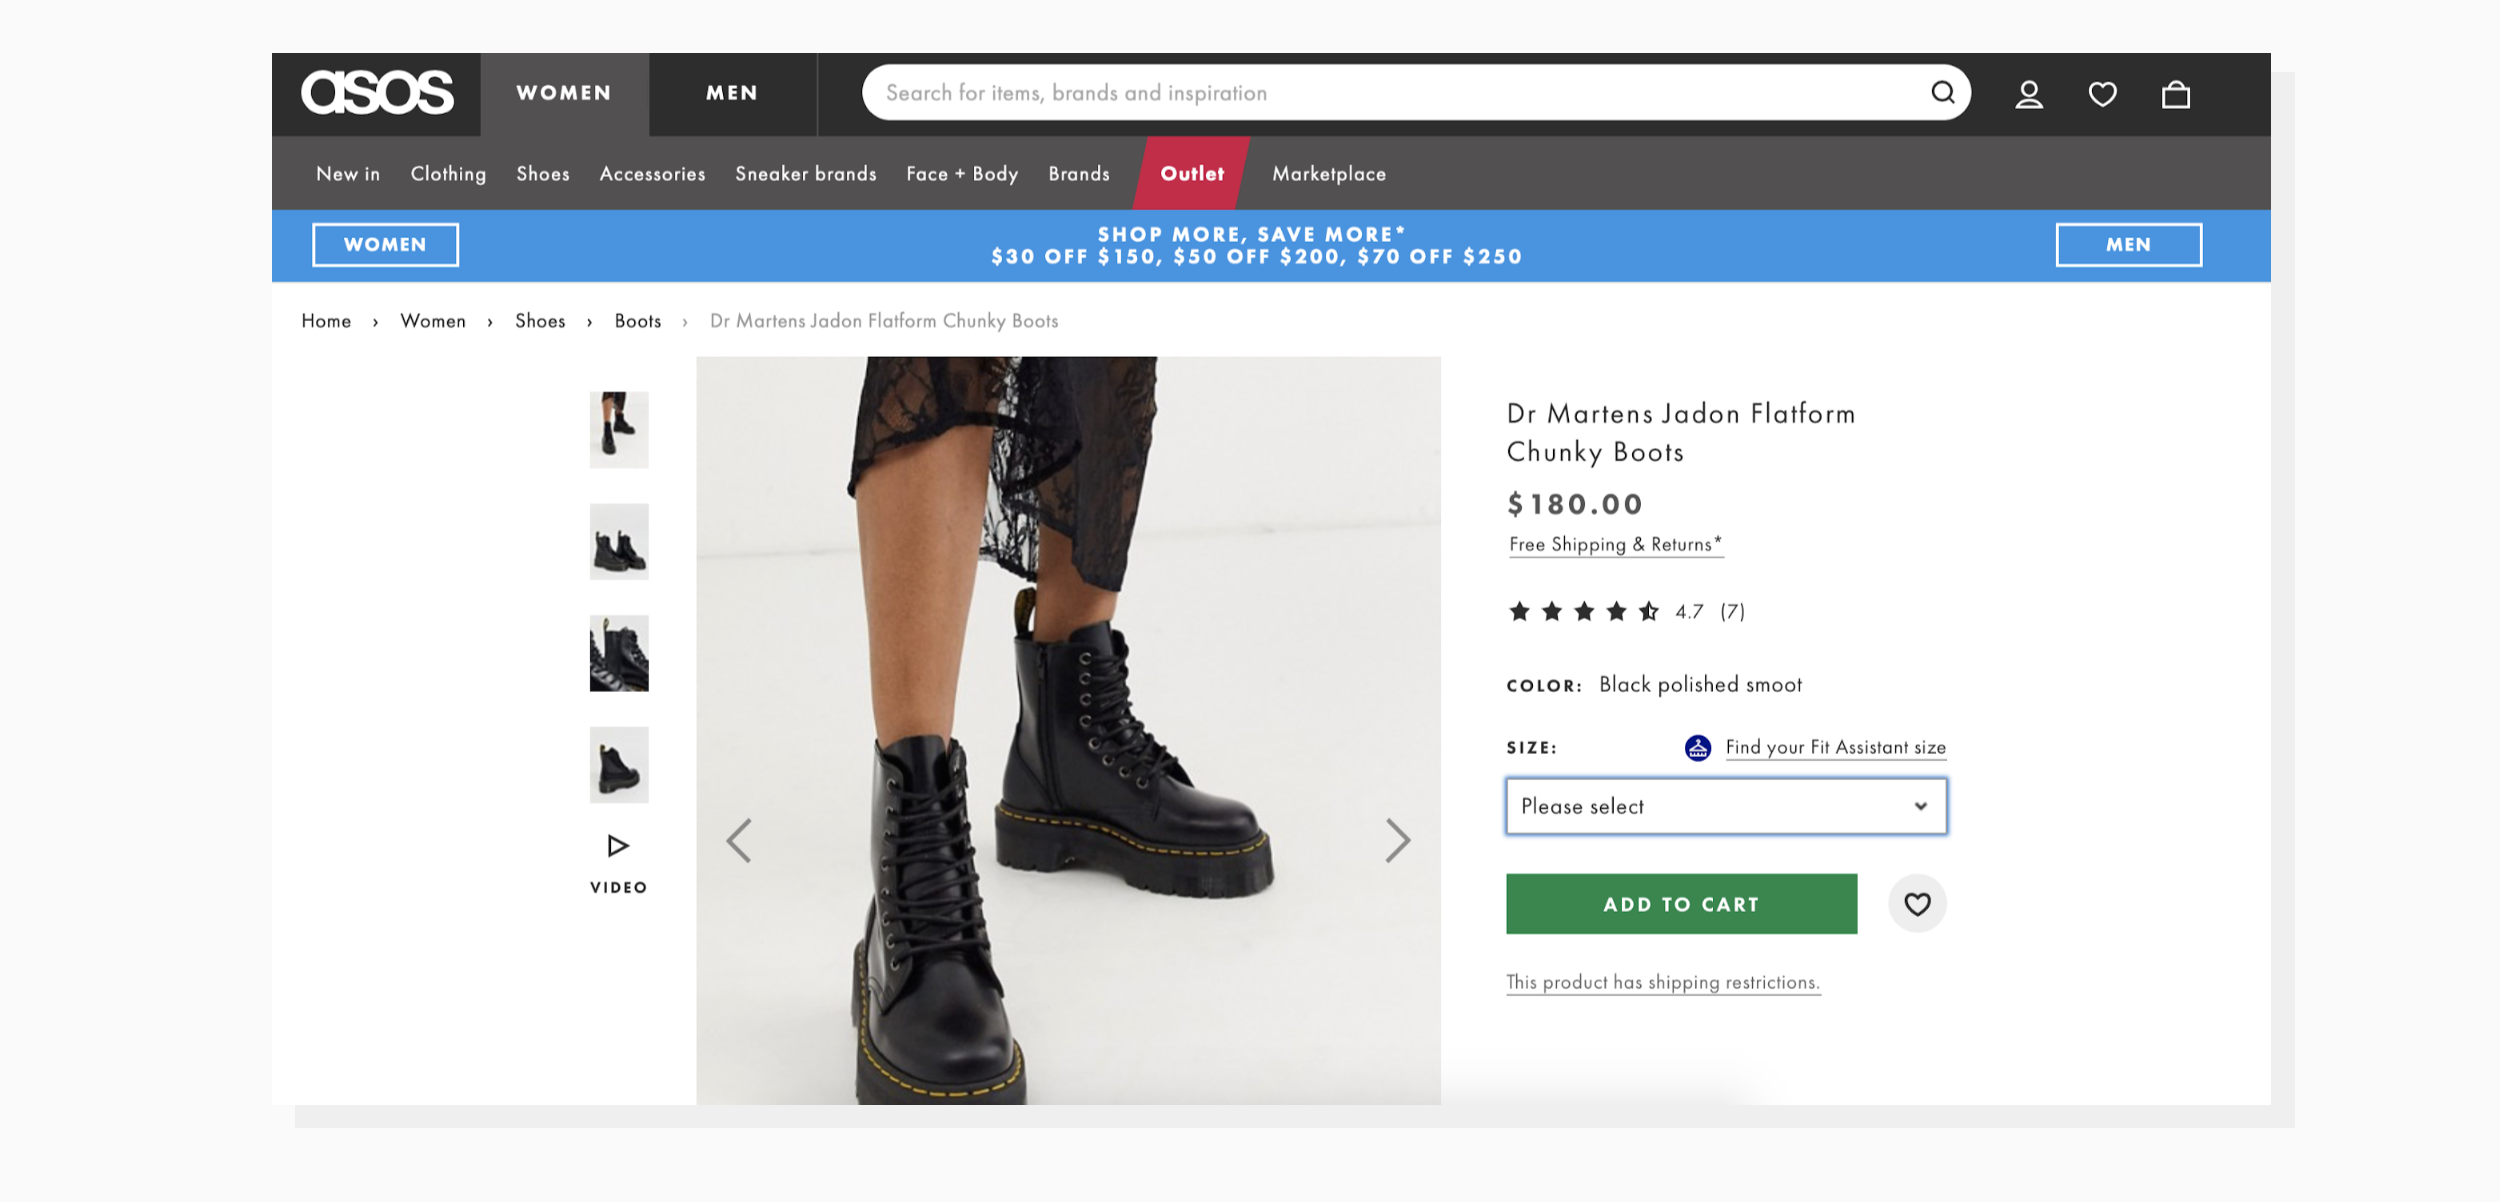
When you open a product page on ASOS, the first thing you see is an image of the item, front-and-center. Large high-quality visuals from different angles and a catwalk video display the item in the best possible light:
 When a visitor clicks on a product, they are greeted with a large image and a small gallery of additional visuals to the left
The quality of visual content is vital because online shopping offers a limited customer experience: you can’t touch the fabrics or try on the clothes. There are AR techniques to reproduce that experience, but still, it will always be a simulation. So, don’t skimp on high-res pictures; they are key.
Having made a stunning first impression, you can further boost the page views by offering look-alike items or product comparisons. ASOS offers a “You might also like” section, which features relevant items. We’re not sure if there’s an AI behind it, but the options complement each other, suggesting new items or accessories that match the chosen style.
When it comes to product comparisons, they work exceptionally well for products with a long list of features, like electric appliances, gadgets, or sporting goods. You can suggest items for comparison as well, multiplying the number of page views.
Tip #3. Make your website faster so users open more tabs
Recall that according to Similarweb, the average session duration for ecommerce in 2020 is 3m 56s, but Wolfgang Digital claims that it’s even less: 2m 57s. That means you have to capture visitors’ attention and show your best stuff almost in the blink of an eye.
Why are we talking about it now? Because the less time it takes for the content to load, the fewer bounces you get, and the more pages visitors open. So if you want to boost your visit depth, pay attention to the page load time. The average value of this metric for ecommerce in 2020 is 5.3s, down from 6.8s in 2019. Google’s recommended value is 2 seconds, so there’s still something to strive for.
The speed of a website mainly depends on the size of its content (in kilobytes if not megabytes). And here we bump into a bit of a catch-22: online shops need quality content to show their goods in the best possible light, but that content should be as light as a feather so as not to jeopardize the overall performance.
Coming back to ASOS: how much server space, bandwidth, and traffic is needed to deliver this amount of media to every user worldwide? Way too much. To stay operational, such media-heavy platforms use content optimization tools that allow them to compress and resize media without compromising on quality.
There are various solutions that help to do that, from open-source libraries to robust ready-to-integrate infrastructures like Uploadcare. Apart from industry-leading compression methods, Uploadcare’s Adaptive Delivery uses a lazy loading technique that renders only the visible part of the page, saving traffic on elements that a person doesn’t view.
The key takeaways
Pages viewed per shopping session is a metric that tells a lot about the quality of content and the overall website performance. It’s calculated by dividing the page views by the total number of visits, and shows how people engage with your content. To boost pages viewed per shopping session, reduce friction and distractions, use quality content, and streamline your design and navigation to help people get an extensive product impression.
In our next post, we’ll look at the number of active users metric. If you’d rather not wait, but would prefer to get familiar with all the key ecommerce metrics right away, grab our concise report.
← Part 1. The total number of visits | Part 3. The number of active customers →