The ultimate guide to eCommerce metrics. Intro
Last edited:
👉 The guide to eCommerce metrics. Intro (you're here)
👉 Part 1. The total number of visits
👉 Part 2. Pages viewed per shopping session
👉 Part 3. The number of active customers
👉 Part 4. eCommerce conversion rate
Any digital business is up to its eyeballs in analytics: metrics and KPIs pave the way to revenues and long-term commercial success. Website visits, CAC, CTR, and ABV… Improving and growing metrics is what most ecommerce professionals are obsessed with.
But how do metrics translate to profits? What to track and focus on? In this series of blog posts, we’ll hack through the jungle of web and product analytics and find some actionable insights. If you don’t feel like a longread, download our recent report and skip the rest.
What are metrics and KPIs?
A metric is any quantifiable measurement that can be tracked inside or outside a product and at any stage of the customer’s journey. A variety of metrics help to describe a business process in figures, making it understandable and manageable.
For example, there are marketing metrics to describe the process of user acquisition, web metrics that reflect your web performance, and product metrics that shed light upon product consumption over time. Eventually, all these run into commercial KPIs that help companies grow.
Growth-hacking business processes based on metrics can lead to a brave new world of opportunities. However, there are also certain limitations to keep in mind:
- Metrics don't mean anything by themselves, so there’s no point tracking them without experimenting and making decisions.
- There is no universal set of metrics. They should be tailored to your business and its processes.
- There are many factors that affect metrics, so it’s better to use iterative experiments and learn how to measure success, especially if you’re running on low volumes of data.
A metric is frequently confused with a KPI. While the first one measures a process, the second one shows the performance of that process and a goal you set to improve it. For instance, total website visits is a metric. 100,000 total website visits is its value. Growing total website visits to 150,000 is a KPI.
Now that we’ve sorted out the terminology, you can already imagine how metrics and KPIs work for your online store. To give you the full picture, let's look at metrics that describe ecommerce.
Ecommerce metrics you should keep an eye on
It’s quite common in ecommerce analytics to set up metrics across the customer's journey and link them to every touchpoint of the shopping experience.
There are five main ecommerce funnel stages: awareness, consideration, purchase (or conversion), retention and advocacy. In an ideal world, your customers would go through them several times, discovering products that fit their needs and making repeat purchases.
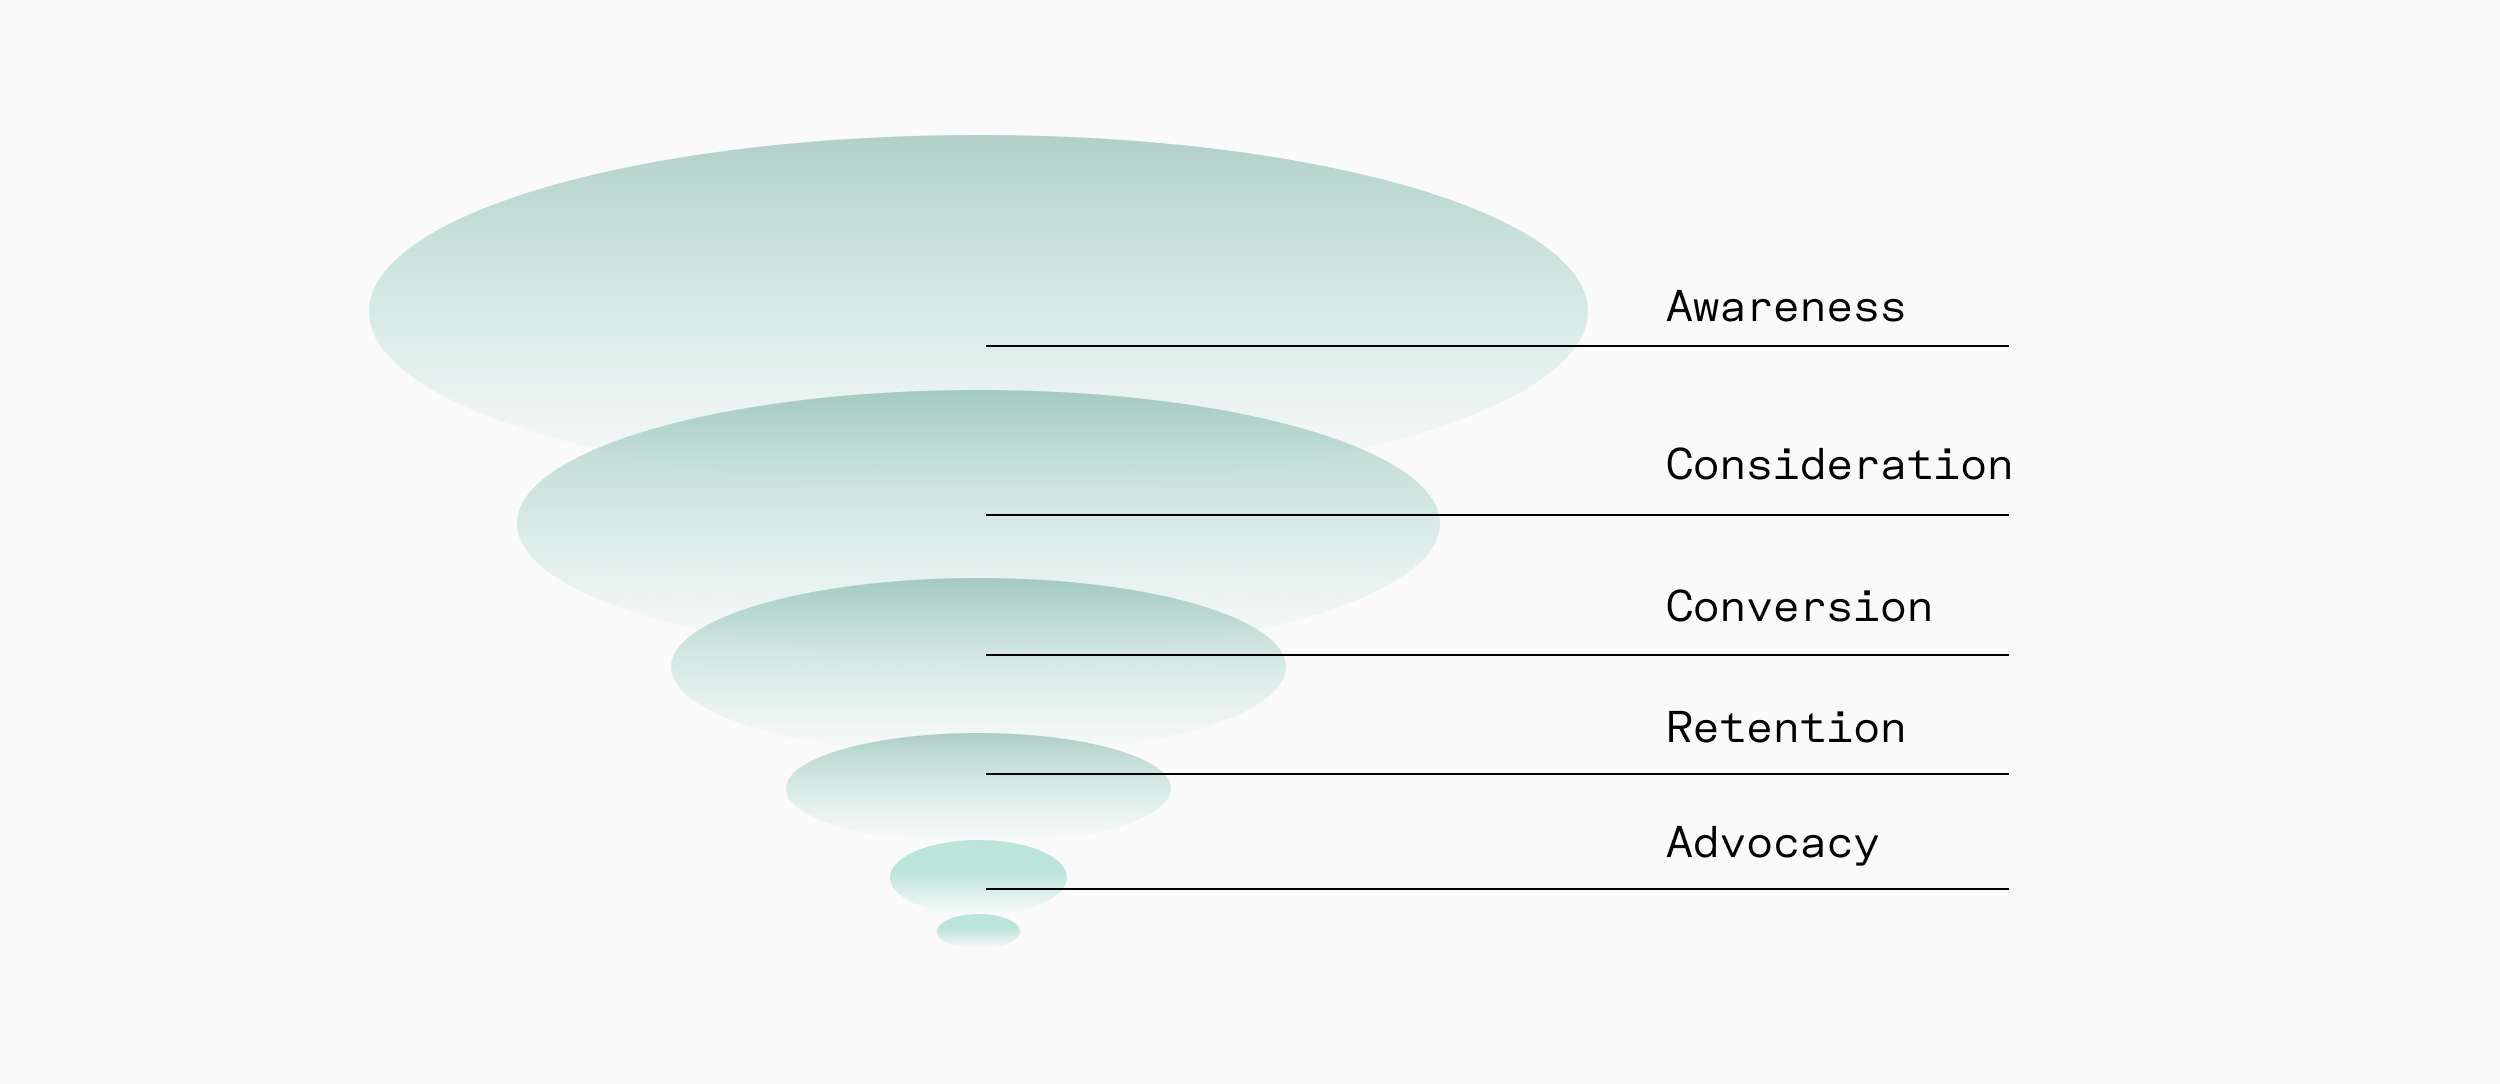 The five stages ecommerce customers go through
-
At the awareness stage, your prospect gets to know about your product from paid ads, organic search results, social media promotion, or any other marketing activity you launch. The awareness metrics will be specific for every channel you choose. For instance, if you use display marketing, then impressions, click-throughs, and average cost per click are the ones to track.
-
At the consideration stage, the prospect is already on your website, engaging with the content. The way they engage can be described in a variety of on-site metrics, such as the total number of visits, bounce rate, and length of session.
-
At the conversion stage, all the metrics related to the prospect's actions on the way to check-out are the ones that matter: namely, cart abandonment rate, average basket value, and sales conversion rate.
-
Retention is all about generating repeat purchases and re-engaging with your customers over time. The most popular metrics here are retention rate, churn, and LTV.
-
The advocacy stage is traditionally the most neglected one, but still, there’s also something to track. Here you can measure word-of-mouth and whether your customers are ready to enter into a long-term relationship and become your loyal brand advocates.
Here are just some of the examples of metrics that you can use to evaluate their experience:
| Awareness | Consideration | Conversion | Retention | Advocacy |
| Impressions (the number of times your ads are displayed) | Page load speed | Orders or successful transactions | Customer retention rate | Number of positive reviews |
| Reach (the total number of people who see your ads) | Total number of visits | Average order value | Repeat customer rate | Subscription rate |
| Social media engagement (likes, shares, follows, mentions) | Bounce rate | Shopping cart abandonment rate | Ecommerce churn rate | Loyalty or referral program participation rate |
| Clicks | Product views per session | Shopping cart sessions | Returning customers | Net promoter score (NPS) |
| Click-through rate | Product page views | Checkout abandonment rate | Refund and return rate | Number of referrals |
| Website traffic | Customer acquisition cost or cost per acquisition | Sales conversion rate | Customer lifetime value | |
| Cost per thousand (CPM) | Cart additions | Revenue per visitor | Revenue from repeat online customers | |
| Average cost per click | Email opt-ins | Gross profit margin |
This list is not and shouldn’t be complete: each business should come up with its own set of relevant metrics to boost specific KPIs or eliminate bottlenecks.
Key and secondary metrics
You can’t pay attention to the whole variety of measurements; otherwise, there wouldn’t be any time left for taking action. The best practice is to decide on some hierarchy of key and secondary metrics that will complement each other.
Key metrics are the ones that should become your KPIs and set the tone for all your activities. Improving those metrics contributes to your strategic goals, provoking a domino effect on other key metrics and further commercial success.
Those metrics that don’t show a direct impact on your business are sometimes called vanity metrics. They vary from business to business. For instance, it’s hard to predict how growing the number of likes on social media channels can affect the bottom line for ecommerce, but it undoubtedly contributes to the business karma of a blogger. However, revenue will be a key metric for both.
As we already mentioned, each business crafts its own set of metrics, and there are no cheat sheets or best practices: it’s all a matter of individual iterative experiments. To start with:
- Set the KPIs or the big goals you’re planning to achieve. For instance, if your goal is to launch a new product category, the KPI could be to achieve 500 orders and $20,000 in sales from the new category in the first two weeks after launch.
- Think about key and secondary metrics that will support this goal. In our example, the key metrics could be the number of orders and the revenue, and the secondary ones could be awareness and consideration metrics, as you’ll probably need to launch marketing campaigns.
- Try to automate the monitoring of the key and secondary metrics by using dashboards. These are your control boards that visualize the metrics and KPIs and show their dynamics.
Sometimes you’ll even need to invent custom metrics. For example, to boost conversions to sign up, Pinterest came up with UPWT. This metric describes user-perceived wait time and shows the milliseconds between typing in a URL and the visible part of a web page being rendered.
By optimizing their content, they got a 40% decrease in UPWT, which led to a 15% increase in SEO traffic and a 15% increase in conversions. Not bad! Now they consider enhancements in web performance the low-hanging fruit for boosting key business metrics.
How to easily monitor ecommerce metrics and KPIs
To stay efficient and spend minimum time collecting and comparing metrics, build a handy dashboard to show your KPIs in real time.
For this purpose, you can use a ready-to-integrate and highly customizable BI tool like Tableau or Chartio. They are easily paired with Google Analytics, and can make your performance and financial metrics meet.
This example is taken from geckoboard. Here are three key financial metrics (gross profit margin, customer acquisition cost, average order value) and three key web metrics (visitors, visitors to sales conversions, cart abandonment rate), which are sufficient to have a bird’s-eye view on the overall performance of an online store:
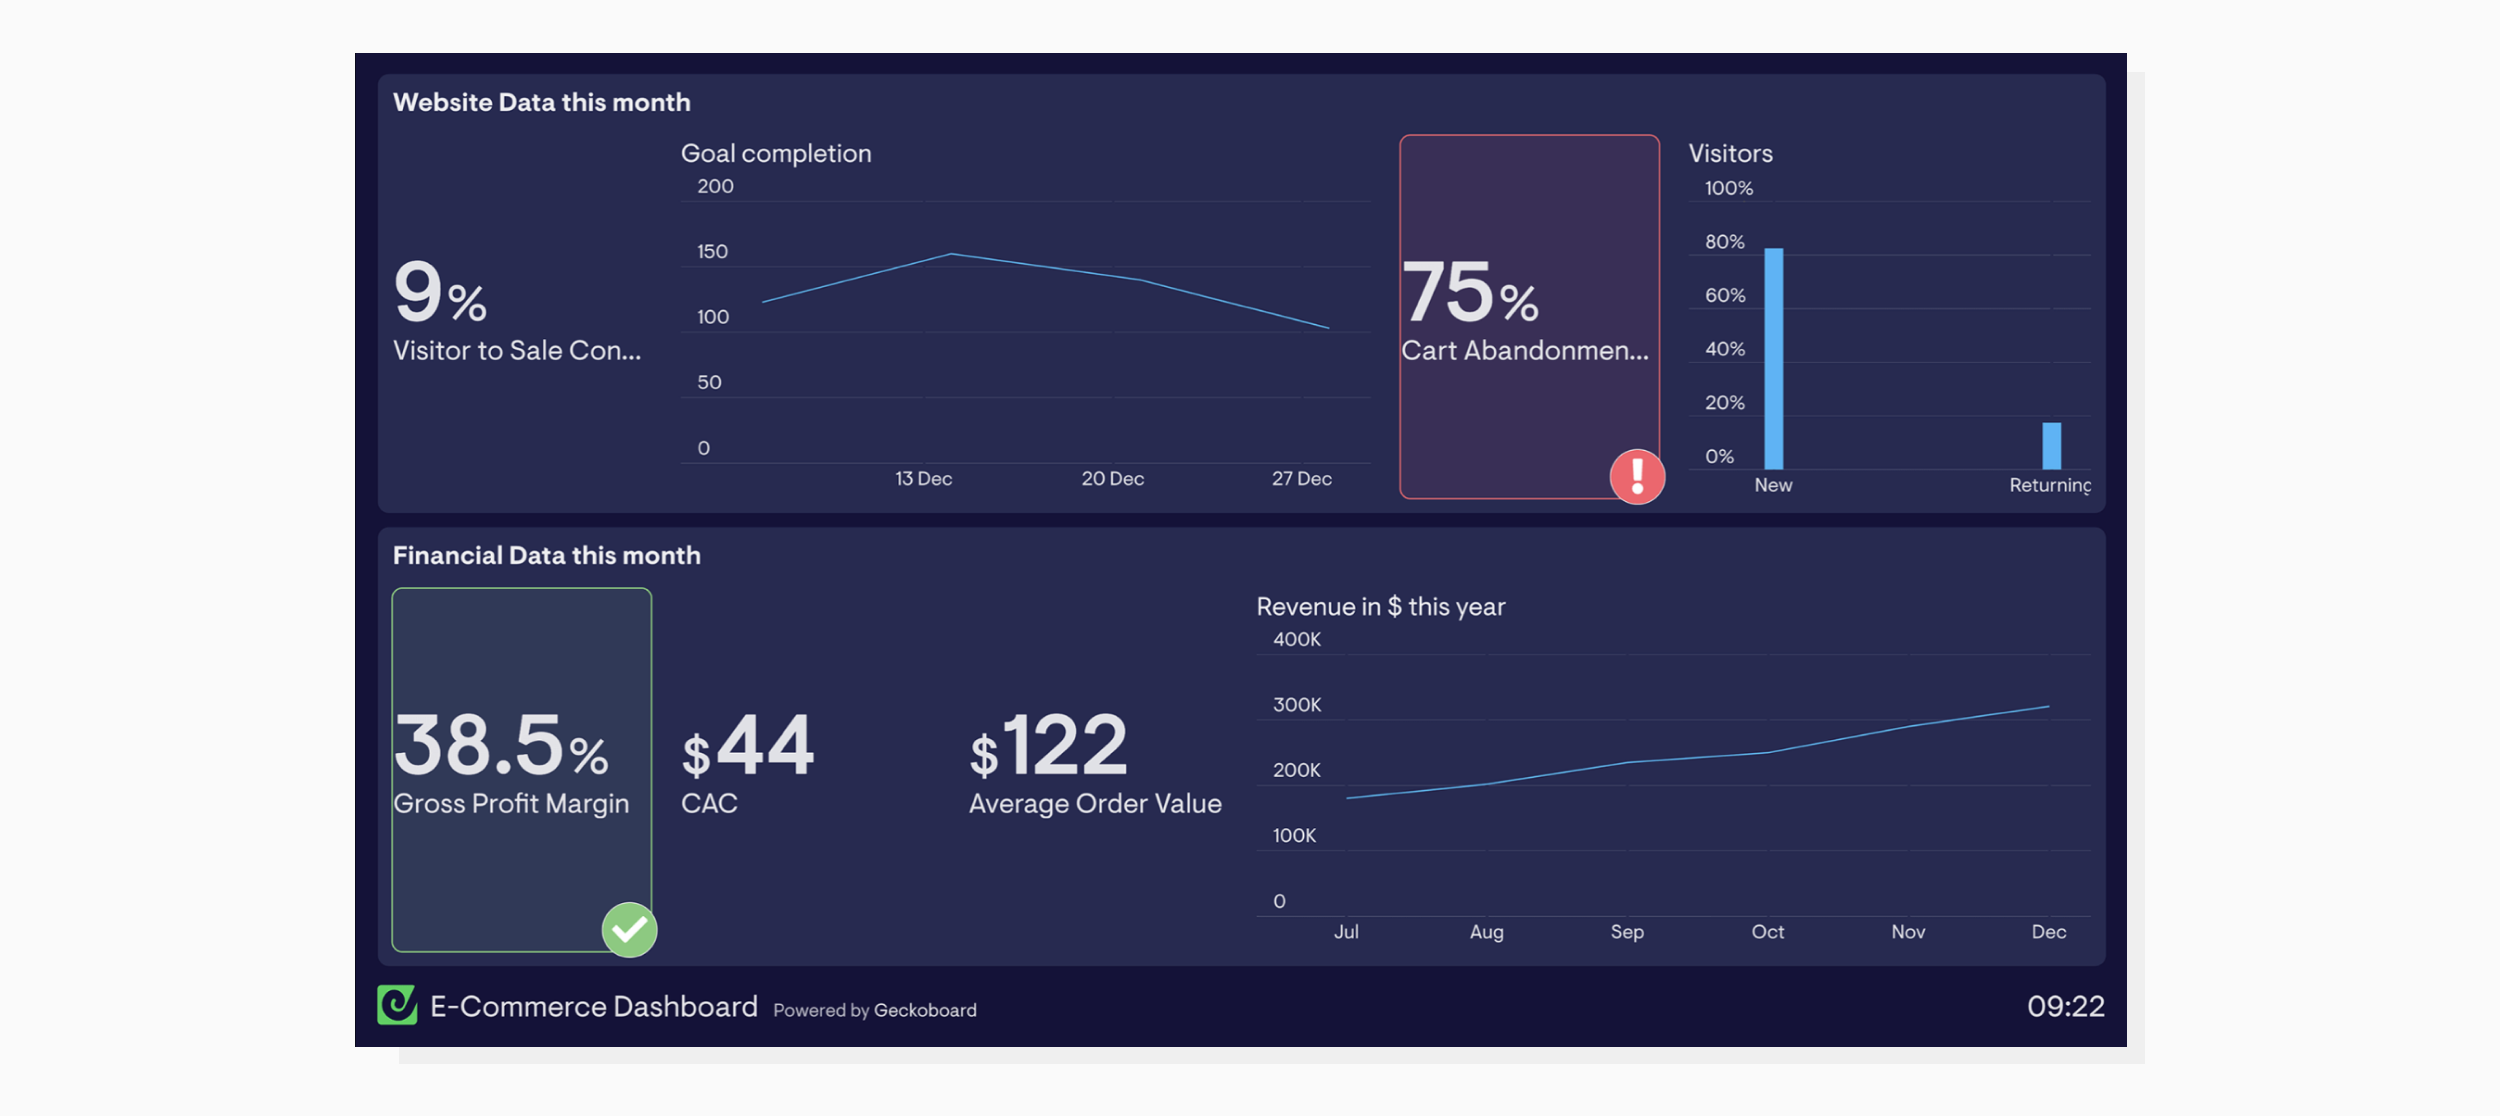 This is what your ecommerce dashboard can look like
Such dashboards will save you time on compiling data and provide powerful visuals to present to your team.
So, which measurements should definitely be visualised on your future dashboards? In our recent report, we examined five crucial ecommerce metrics, and explained how to improve them by using web optimization.
Download the report or continue reading. Next we’ll look at ecommerce metric #1: the total number of visits.